A buyer’s guide to entry-level luxury acreage
Snohomish County acreage homes.The $1M–$2M market.
Compare local areas, see what acreage homes are selling for, and understand the market for properties on more than one acre. Find a clearer starting point for your search.
Median closed-sale price
$1,225,2502.3% below the same 2025 periodMedian cumulative days active
30 days18.5 days in the same 2025 periodCompleted sales in this segment
244250 in the same 2025 periodThe short answer
This $1M–$2M acreage sample shows modest price softness and longer cumulative marketing time. Buyers still move quickly on some properties: about 39% of 2026 sales recorded 14 or fewer cumulative days active. Location, improvements and usable land matter when you compare your options.
01 / Compare local areas
Where should your acreage search begin?
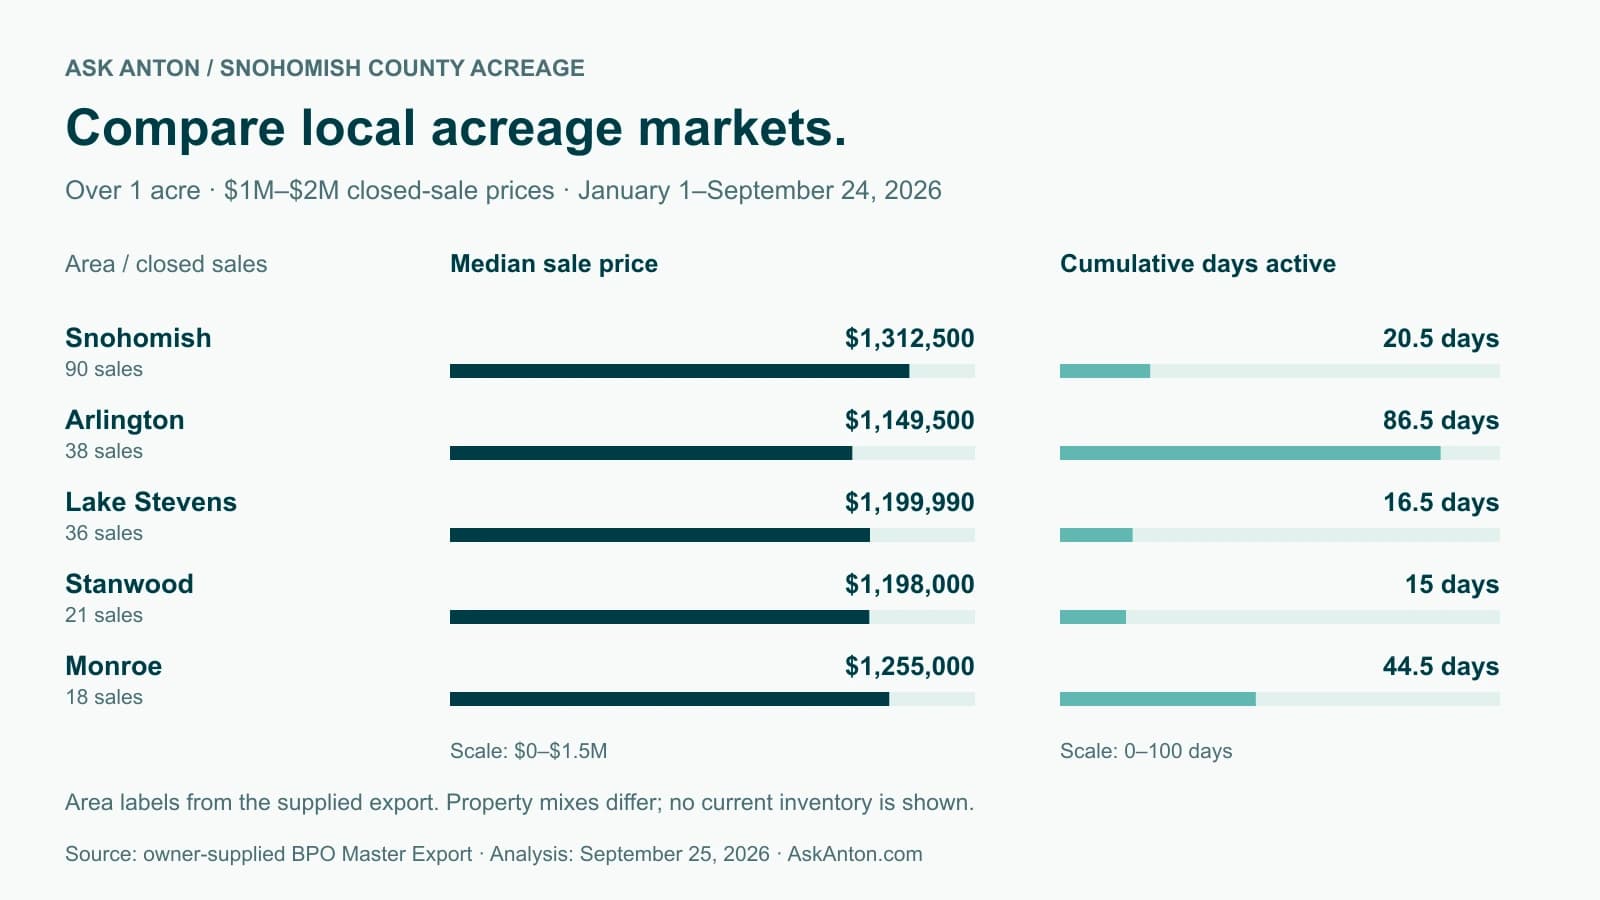
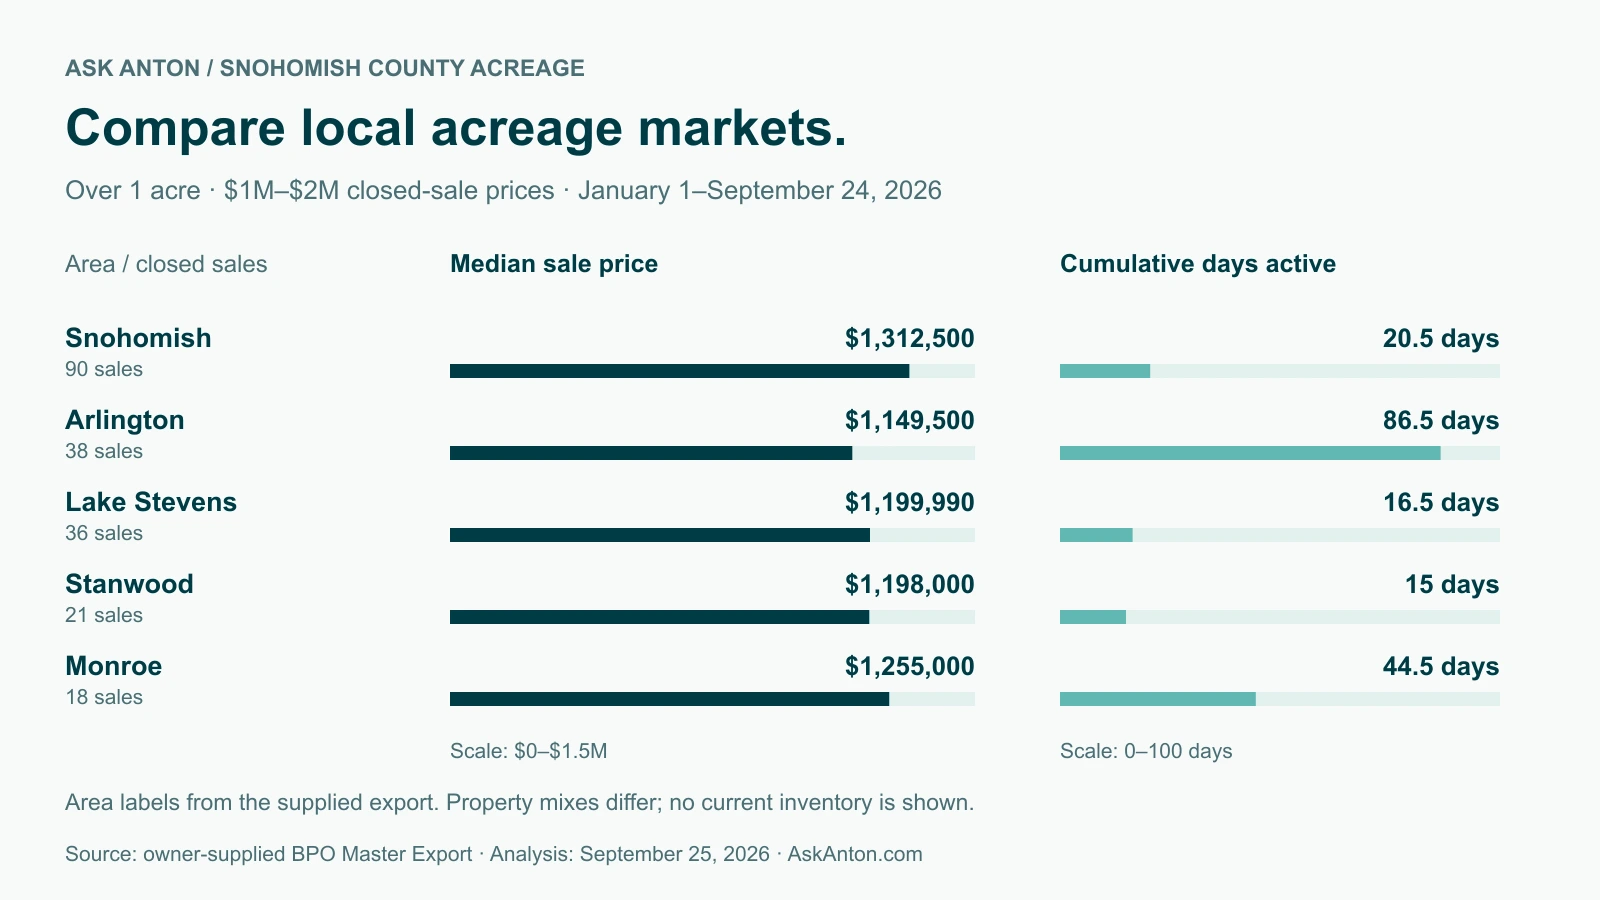
Look at price and market time together. These five area labels have the largest 2026 samples in the export. All figures below are for closed sales of $1M–$2M homes on more than one acre.
What buyers paid
Median closed-sale price · 2026 through September 24
How long listings were active
Median cumulative days · Same completed sales
Median parcels: 2.86 acres in Snohomish and 5.07 acres in Arlington. These are different property mixes, not matched homes.
See the area comparison table
| Area label | Sales | Median price | Cumulative days | Acres | Home sq. ft. |
|---|---|---|---|---|---|
| Snohomish | 90 | $1,312,500 | 20.5 | 2.86 | 3,142.5 |
| Arlington | 38 | $1,149,500 | 86.5 | 5.07 | 2,958.5 |
| Lake Stevens | 36 | $1,199,990 | 16.5 | 1.39 | 2,924.5 |
| Stanwood | 21 | $1,198,000 | 15 | 4.7 | 2,829 |
| Monroe | 18 | $1,255,000 | 44.5 | 5 | 2,963.5 |
Counts represent completed sales, not available homes. Area selections highlight comparisons and carry into your search brief; they do not change the county-selection trend charts.
Use these areas in my search plan →02 / Make it specific to you
Build your Snohomish + Arlington acreage starting point.
Tell us what more space means to you. Your selections stay in this page until you choose to download a brief or prepare a request.
A useful property shortlist starts with your plans.
A workshop, usable pasture or a quieter setting can lead to very different searches. Start with the areas you compared, then bring the details to Anton and the team.
- Selected areas: Snohomish + Arlington
- Properties on more than one acre
- Budget, timing and intended use
The report uses closed-sale prices. Your search budget is a preference for a future purchase; it does not establish current listing availability.
Review usable outdoor space, neighboring uses, access and the setting.
Email opens an editable draft to info@askanton.com. You send it from your email app. The brief downloads immediately; no signup is required.
Continue the conversation
Ask in your own words.
Chat is coming soon. For now, email the team. Nothing has been sent from this page.
AntonAI is an automated assistant. Chat sessions are recorded. Its responses are informational and should be verified. About using AntonAI
By sending a message, you agree to our Terms of Use, including arbitration and use of your submissions in content, and acknowledge our Privacy Policy.
When you email the team, your message and contact details are handled under our Privacy Policy. Other contact options · Brokerage and AI disclosures
03 / Understand the trend
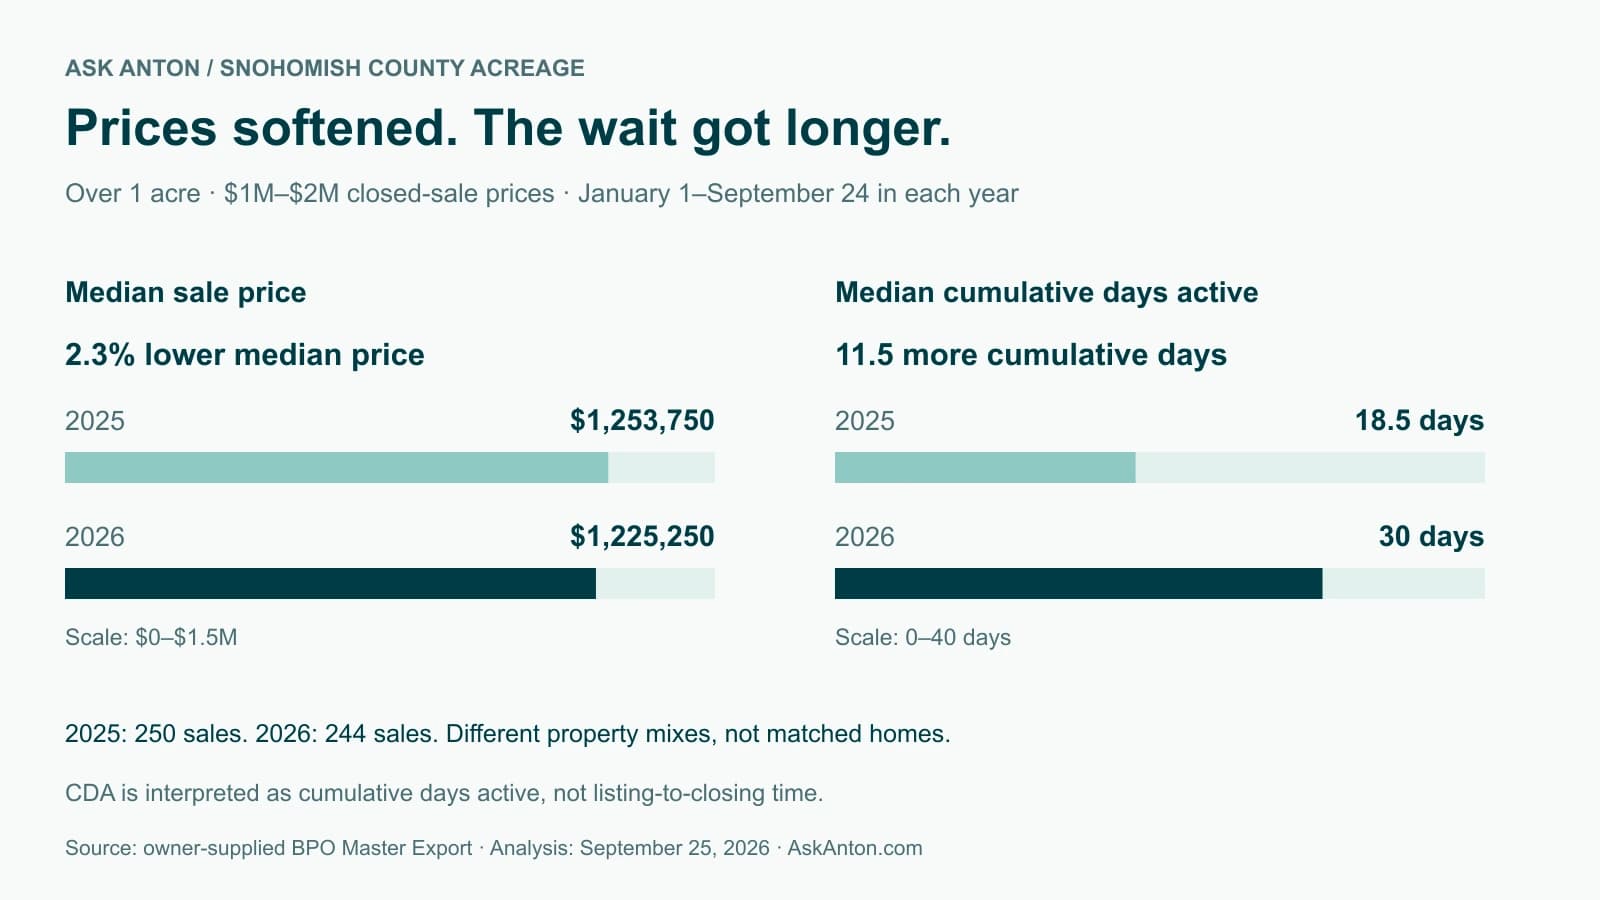
Prices softened. The wait got longer.
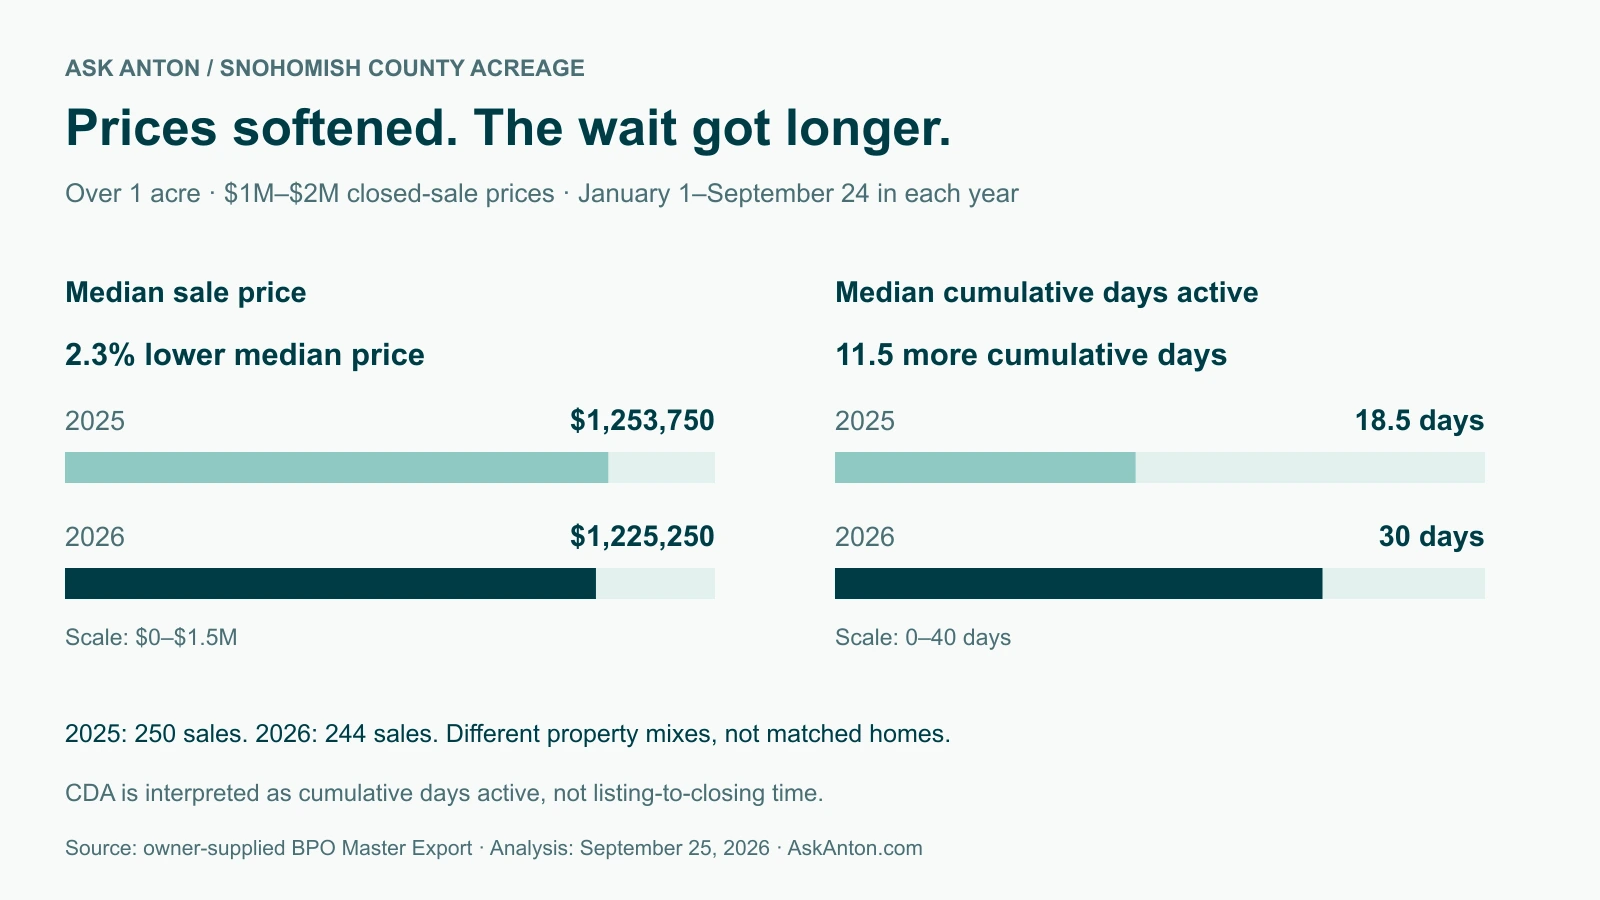
Compare January 1–September 24 in both years. The stronger change is in cumulative marketing time; the median price decline is relatively small.
| Measure | 2025 | 2026 |
|---|---|---|
| Closed sales | 250 | 244 |
| Median sale price | $1,253,750 | $1,225,250 |
| Median cumulative days active | 18.5 | 30 |
| Median individual-listing days | 17 | 18 |
| Sales with 90+ cumulative days | 13.2% | 22.5% |
| Sales above final asking price | 21.6% | 18.9% |
| Median parcel acreage | 2.3 | 3.55 |
| Median home size (sq. ft.) | 3,133 | 3,031.5 |
A changing median is not an individual home valuation.
The median parcel grew from 2.30 to 3.55 acres while median home size decreased. The homes sold in each period are different. Use the trend as context, then examine comparable properties in the specific area.
The latest matched period, July 1–September 24, shows 105 sales in 2025 versus 84 in 2026. Median cumulative days increased from 25 to 37.5. September is incomplete; the comparison stops on September 24 in both years.
04 / Read the asking-price history
“Close to asking” can miss part of the story.
A seller may reduce the asking price before an offer is negotiated. Compare the sale to both the recorded original price and the final listing price.
| Pricing group | Sales | Cumulative days | Sale / original ask | Sale / final ask |
|---|---|---|---|---|
| No net asking-price reduction | 173 | 13 | 100.0% | 100.0% |
| Recorded asking-price reduction | 71 | 84 | 91.5% | 97.6% |
For buyers
Use marketing time and price history to form better questions. Investigate the property, review relevant sales and consider the complete terms before deciding what to offer.
What these figures cannot tell you
This export has no seller concessions, inspection findings or full listing history. The observed differences do not prove that pricing alone caused the outcome, and they are not an automatic offer discount.
05 / Think beyond the acre count
More land changes the comparison.
Larger parcels show longer median cumulative market time in this sample. That does not isolate the effect of acreage from location, the home or improvements.
| Parcel size | Sales | Median price | Cumulative days |
|---|---|---|---|
| Over 1–2 acres | 92 | $1,222,500 | 18.5 |
| Over 2–5 acres | 86 | $1,250,000 | 26.5 |
| Over 5–10 acres | 51 | $1,226,000 | 35 |
| Over 10 acres | 15 | $1,220,000 | 46 |
The over-10-acre group contains only 15 sales; treat it as a limited sample. Acreage bands include their upper endpoint.
Usable land
How much of the parcel supports your intended use? Identify what needs verification before treating the whole acreage as usable.
Access and location
Does the approach, drive and location work for everyday life? Review the actual property and recorded documents.
Home and improvements
What already exists, what condition is it in, and what documentation or investigation would a future use require?
A short briefing for sellers
Selling an acreage property around $1M–$2M?
The 2026 sales with recorded asking-price reductions had a median 84 cumulative days active and sold at 91.5% of recorded original asking price. Sales without a net reduction had a median 13 cumulative days. Condition, location and property differences also affect these outcomes.
A pricing review should start with your own home, improvements and usable land, then compare relevant recent sales.
Ask about my property’s market position →Buyer questions, answered directly
Questions about this acreage market.
What does this Snohomish County acreage report cover?
This report analyzes the owner's Snohomish County selection of homes with more than one acre that sold for $1 million to $2 million. The main comparison covers January 1–September 24 in 2025 and 2026. It is a closed-sale snapshot, not a list of homes available today. Acreage includes large-lot suburban properties as well as rural settings.
Are $1M–$2M acreage home prices falling?
In this sample, the median closed-sale price decreased 2.3%, from $1,253,750 in 2025 to $1,225,250 in 2026, comparing January 1–September 24 in each year. The mix of properties also changed. This is not a 2.3% valuation adjustment for every home.
Which local acreage markets should buyers compare?
Start with areas that fit your location and property needs. In the 2026 sample, Snohomish, Arlington, Lake Stevens, Stanwood and Monroe have 90, 38, 36, 21 and 18 qualifying sales respectively. Compare price and cumulative days alongside acreage, home size and improvements; these are not matched homes or rankings of the best places to live.
How long are acreage listings staying on the market?
The 2026 sample has a median 30 cumulative days active, compared with 18.5 in the same 2025 period. But 95 of 244 sales, about 39%, recorded 14 or fewer cumulative days. CDA is interpreted here as cumulative days active. It is not the elapsed time from listing to closing.
Do acreage buyers have room to negotiate?
Outcomes vary. The 71 sales with a recorded asking-price reduction closed at a median 91.5% of original asking price and 97.6% of final asking price in 2026. Those figures describe completed transactions, not a recommended offer discount. The export does not include seller concessions or the full price history.
Does more acreage automatically mean more value?
This sample does not establish an independent value for each additional acre. Location, the home, improvements and usable land vary together. Median cumulative days range from 18.5 for over 1–2 acres to 46 for over 10 acres, with only 15 sales in the largest-acreage group.
Is $1M–$2M considered luxury acreage?
Entry-level luxury acreage is a useful way to describe this search, not a formal property classification in the export. The measurable criteria are a $1M–$2M closed-sale price and a parcel larger than one acre. The home, setting and improvements vary substantially within that range.
Can I get help building an acreage shortlist?
Yes. Use the search planner on this page to choose areas, a budget range, property priorities and timing. Download your comparison brief or prepare an email request to Anton and the team. A shortlist request is not a claim that matching properties are currently available or that a tour has been booked.
Source, scope and limitations
How we built this report.
AskAnton analyzed an owner-supplied BPO Master Export on September 25, 2026. The file contains 1,766 listing records. Excluding 98 records at exactly one acre leaves 1,486 qualifying closed sales from January 31, 2022 through September 24, 2026. The main tables compare 2025 and 2026 through the same September 24 cutoff.
- Price and acreage: sale prices from $1,000,000 through $2,000,000 inclusive; recorded lot size strictly greater than 43,560 square feet. Exactly one acre is excluded.
- Geography: the report uses the owner’s Snohomish County selection and the export’s city labels. County boundaries and rural land-use classifications are not fields in the file. “Acreage” includes large-lot suburban properties; it does not establish rural zoning.
- Market time: CDA is interpreted as cumulative days active; DA as individual-listing days. The export does not supply a field dictionary. These are reported figures, not elapsed calendar days from listing to closing.
- Medians and ratios: ratios are calculated for each sale, then summarized by their median. Recorded price reduction means final listing price is below recorded original price. This is not a reconstruction of every prior listing.
- Coverage: no duplicate listing IDs were found. No duplicate closed-sale events were identified using address, sale date, price, home size and lot size in the initial review. Repeat sales in different periods are separate observations. The five comparison areas account for 203 of the 244 qualifying 2026 sales.
- What is missing: listing status, concessions, condition, verified usable acreage and a complete price history. Records without closing dates are excluded from the sales charts. No active-inventory count, months of supply or live property availability is claimed.
- Interpretation: filtering to a fixed price band excludes properties sold outside that band. Changes in sale counts and medians describe this sample, not the entire county market or the appreciation of an individual home. This is educational market context, not an appraisal.
The original export contains listing-level information and is not republished here. This is a dated snapshot, not a live feed. Future updates require a new export and review using the same definitions.