

How to read the numbers
This article reflects the November 17 episode and the supplied research. Forecasts, proposals, enacted measures and audit findings are identified separately. The original slides are preserved; clarifications appear alongside them. Linked rate pages, election results and agency guidance may change.
Slide 01 / 11
A $4 billion gap. Six different household budgets.
Washington’s next budget debate starts with a timing problem: the cost of continuing services reaches the state before a major new source of tax revenue does. The choices made in Olympia can reach a household through its business, commute, property, rent or access to public services.
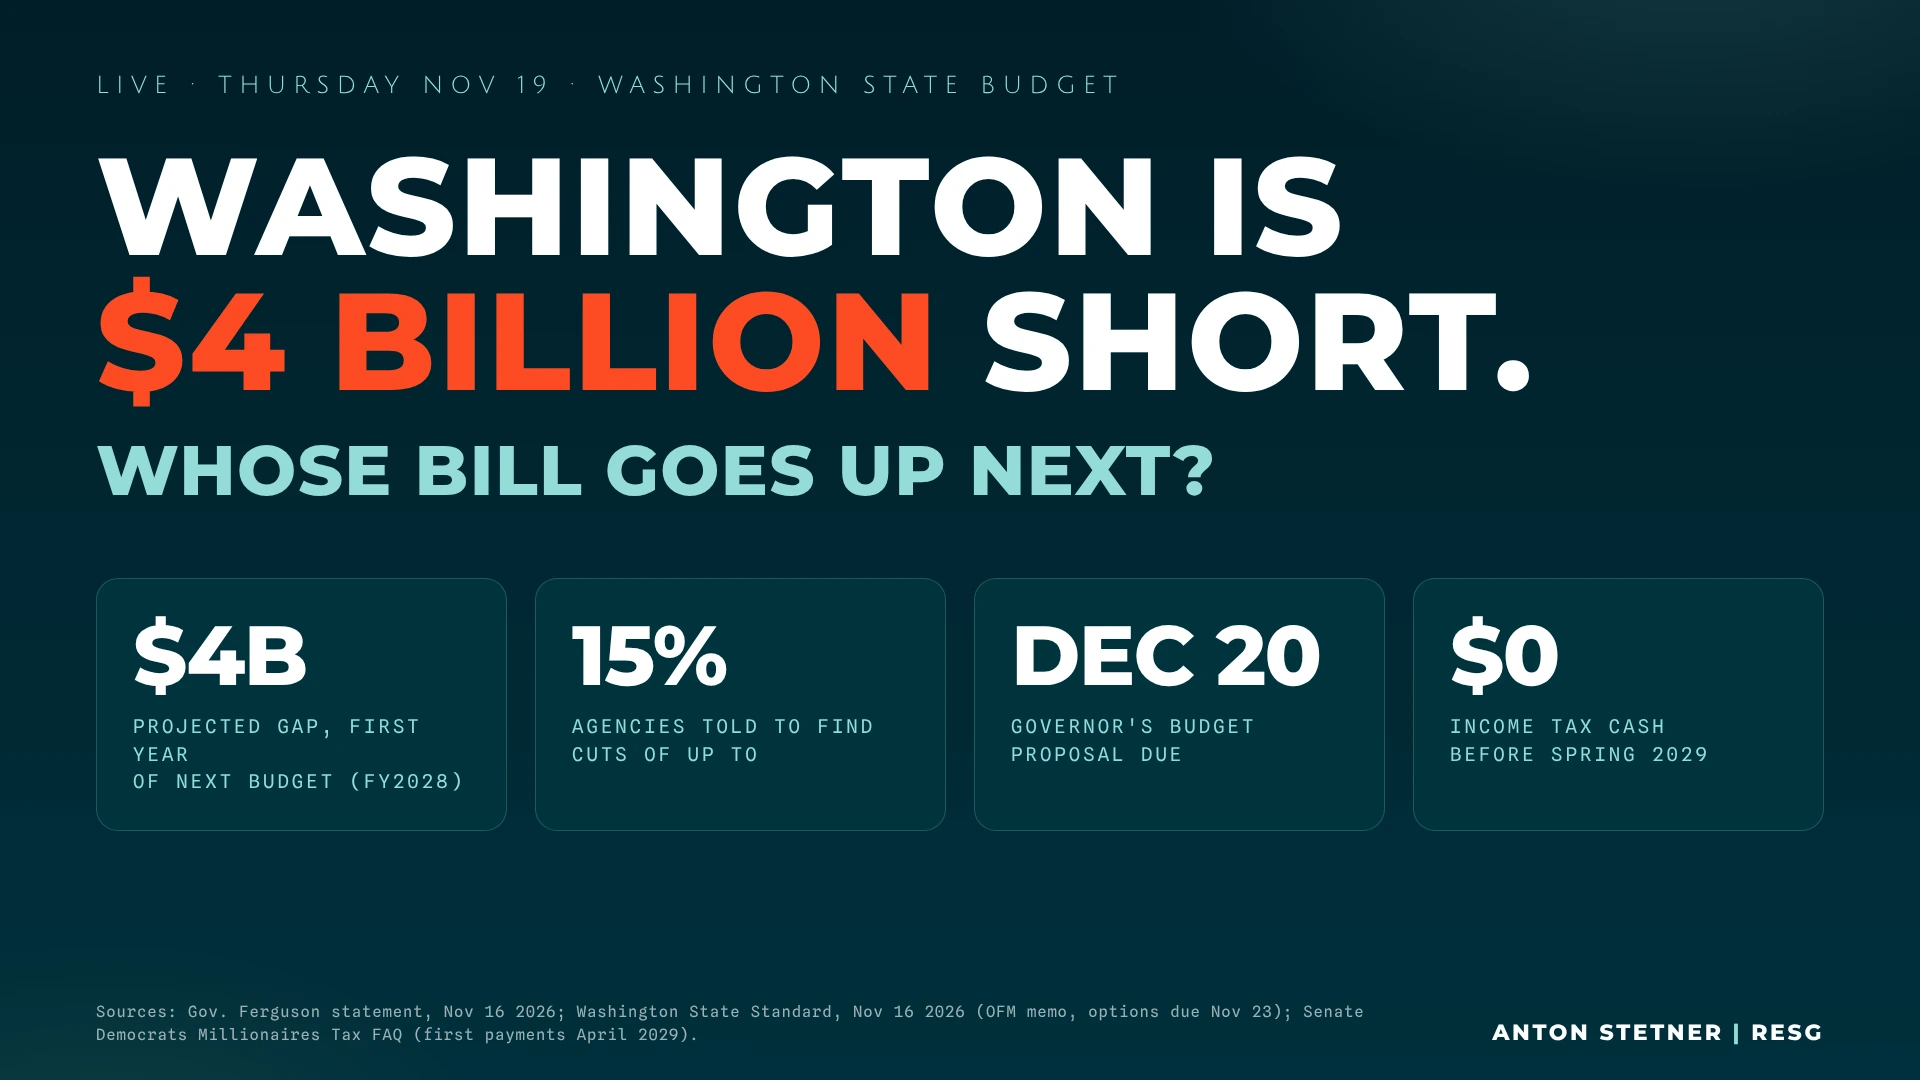
Reading note. Episode date: November 17, 2026. The original title slide says Thursday, November 19; that was a planning date. The slides are preserved as supplied, with clarifications in the article.
What the headline actually measures
The governor’s November 16 statement describes an approximately $4 billion shortfall in the first year of the next budget. OFM’s accompanying instructions frame it as the difference between available resources and the cost of maintaining current services and necessary investments through fiscal year 2028. FY2028 runs from July 1, 2027, through June 30, 2028.
That is a projected resources gap. It is not a claim that one month’s tax collections suddenly fell by $4 billion, and it is not the same measure as the older four-year budget estimates discussed later in the episode.
Requested reductions are the start of a process
OFM directed cabinet agencies to prepare 10% and 15% reduction options for FY2028 Near General Fund accounts, with submissions due November 23. Those options inform the governor’s proposal and the Legislature’s decisions. They do not establish an enacted 15% cut to every agency or every service.
Ferguson said he would announce his budget proposal by December 20. The substantive question is which combination of spending restraint, program changes, reserves, transfers and revenue measures will bridge the gap.
Slide 02 / 11
The forecast barely moved. The commitments did not disappear.
A small forecast revision and a large budget shortfall can exist at the same time. A revenue forecast estimates collections; a budget outlook compares resources with obligations, policy choices and the costs of maintaining services.
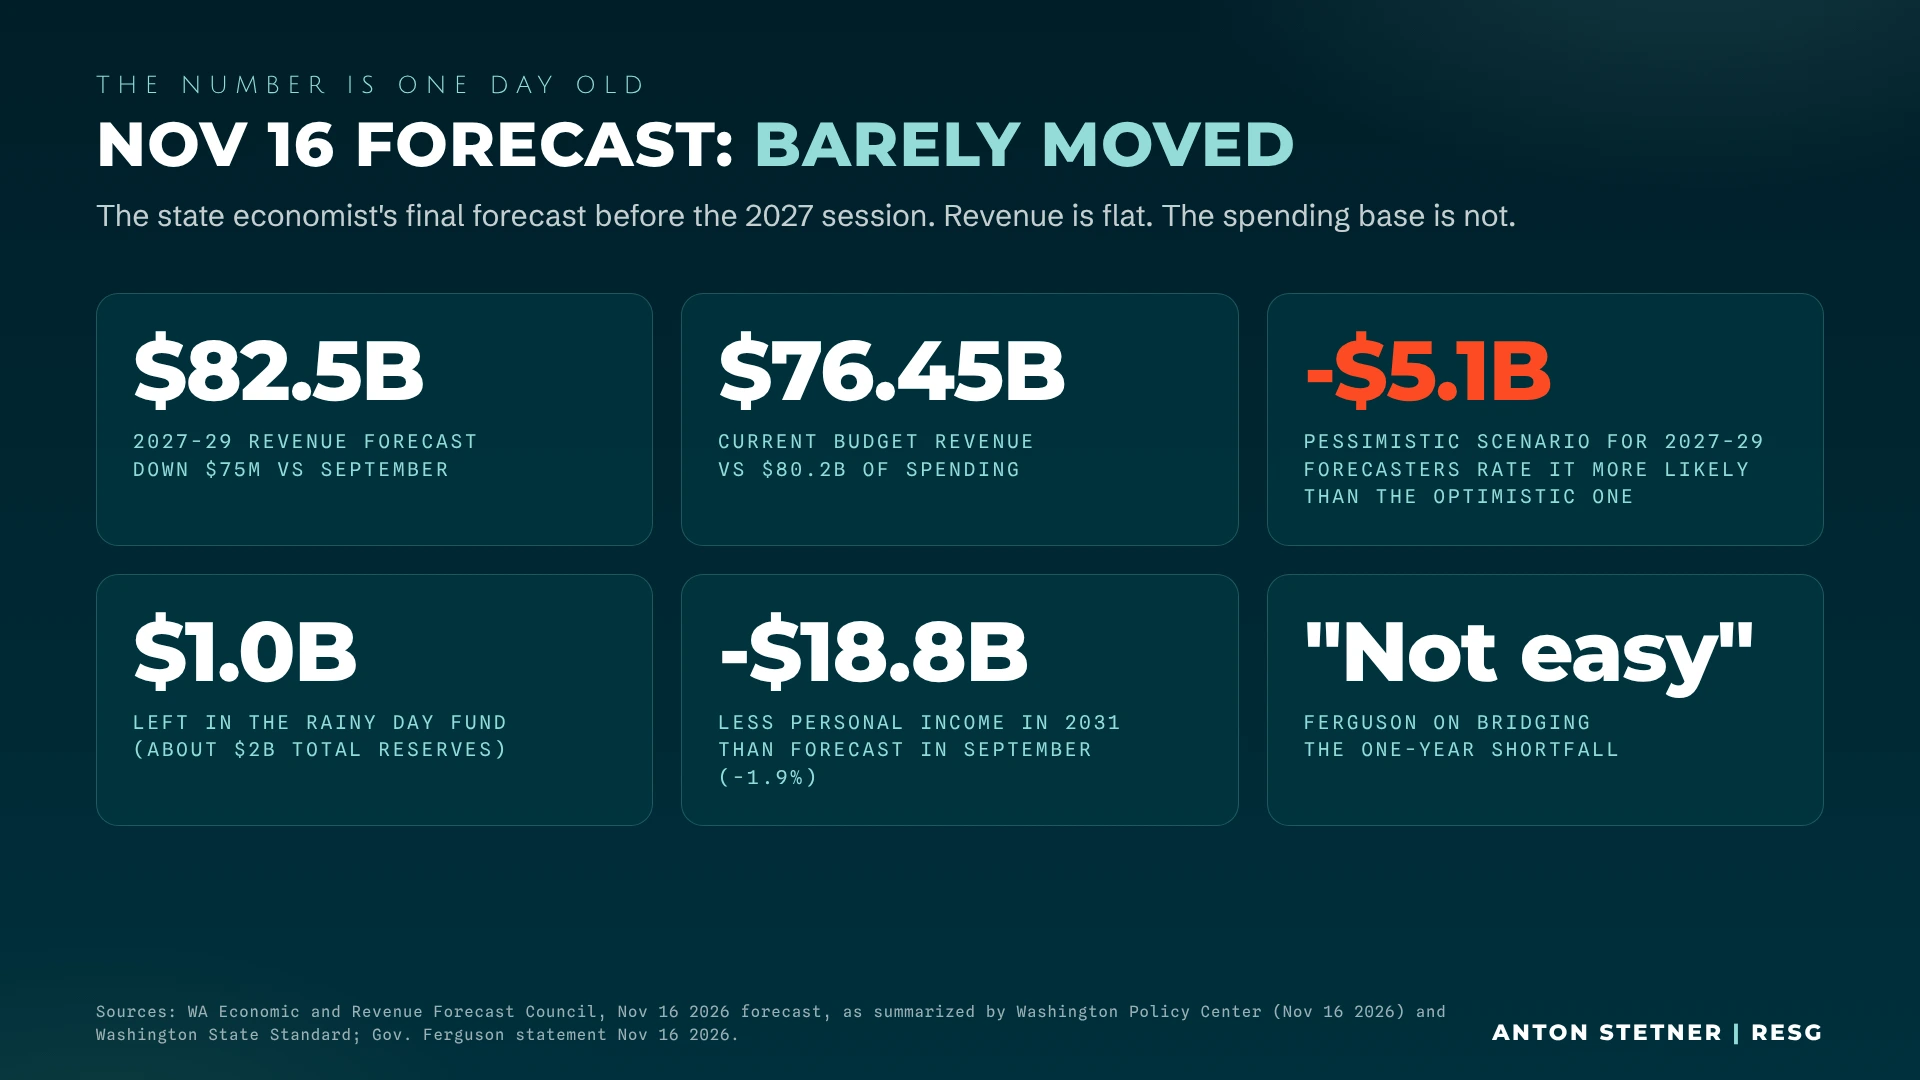
| Measure | Slide figure | How to read it |
|---|---|---|
| 2027–29 revenue forecast | $82.5 billion | About $75 million below the September forecast; a two-year estimate. |
| 2025–27 revenue / spending | $76.45B / $80.2B | The research describes roughly $3.75B financed with balances, transfers and other one-time resources. |
| Pessimistic 2027–29 scenario | $5.1 billion less | A downside scenario relative to the baseline, not an additional enacted spending cut. |
| Rainy day fund | About $1.0 billion | The slide describes approximately $2B in total reserves including other accounts. |
| 2031 personal-income outlook | $18.8 billion lower | A 1.9% downward forecast revision, not a measured $18.8B migration loss. |
The governor’s explanation and the fiscal critique
Ferguson attributes the near-term challenge to rising costs and federal funding reductions, including health-care cuts. His November statement also says the state is using more realistic growth assumptions and expects greater stability beginning July 1, 2028. Washington Policy Center’s analysis emphasizes recurring spending above recurring collections and the risk of relying on one-time balances. Those are attributed policy interpretations, rather than interchangeable official forecasts.
The slide’s $82.5B and reserve figures come through the episode’s Washington Policy Center research. The official forecast documents and OFM instructions remain the place to check definitions, revisions and the final adopted outlook.
What did Ferguson inherit, and what did he do?
The research traces a changing multi-year imbalance: more than $10B in November 2024, more than $12B in January 2025, approximately $15B in February, and the $16B figure Ferguson later used. The time horizon and assumptions changed. Treating all of those as competing estimates of a single-year deficit would mislead readers.
In February 2025 Ferguson proposed about $3.926B in savings through measures such as furloughs, lower travel and equipment spending, consolidation, delayed expansions and reduced provider-rate growth. A governor’s savings proposal is not the same as an executive order enacting every listed reduction. Legislative budgets and supplemental budgets determine the final result.
The first research document also cites a Research Council accounting, through WPC, of $7.0B in reductions and $8.4B in additions in the 2025–27 budget, followed by $970M in reductions and $1.59B in additions in the 2026 supplemental. Gross cuts and additions can occur together; their size alone does not show whether the final budget grew or shrank.
Slide 03 / 11
Spending, revenue, population and inflation need the same frame.
The central chart asks how the operating budget changed relative to a simpler benchmark: the same starting budget adjusted for more residents and higher prices. It is a useful comparison when the fund definition, time period and assumptions stay visible.
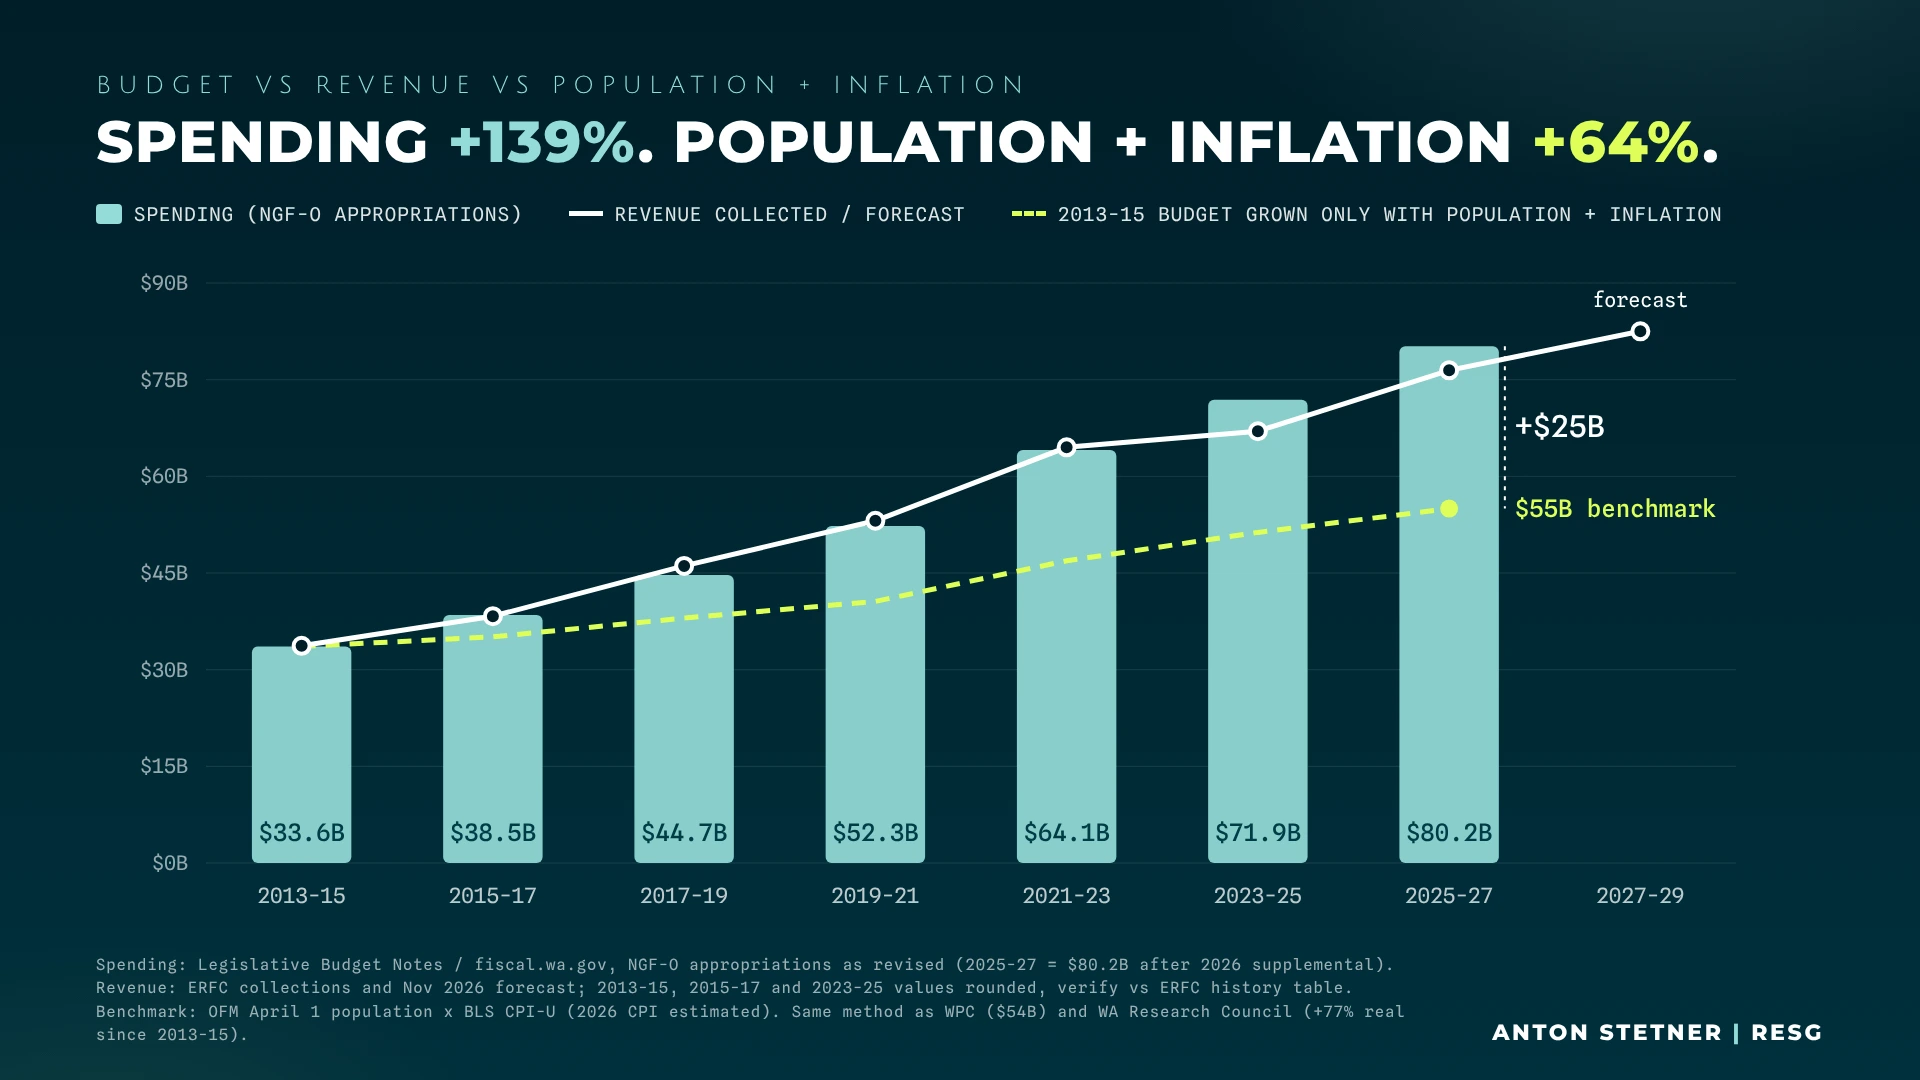
Reading note. Method: grow the starting budget by the population ratio multiplied by the CPI ratio. Simply adding population growth and inflation produces a different benchmark. The original research estimates are retained with their limitations.
| Budget period | Spending shown |
|---|---|
| 2013–15 | $33.6B |
| 2015–17 | $38.5B |
| 2017–19 | $44.7B |
| 2019–21 | $52.3B |
| 2021–23 | $64.1B |
| 2023–25 | $71.9B |
| 2025–27 | $80.2B |
What the chart shows
The series rises about 139% from its first rounded value to its last. The slide’s population-and-inflation benchmark reaches approximately $55B, about 64% above the starting point. That leaves approximately $25B between the benchmark and the slide’s final spending figure. The benchmark is a comparison scenario, not a finding that every dollar above it is unnecessary.
The research describes spending as revised Near General Fund–Outlook appropriations, revenue as ERFC collections and forecasts, population as OFM April 1 estimates, and inflation as BLS CPI-U. The 2026 inflation input was estimated. Early revenue values were rounded and marked for checking; the 2027–29 revenue endpoint is a forecast. The line should not be treated as an audited reconciliation of every biennium.
A second graph answers a different question
The November 17 outline proposes a separate indexed comparison: approximately 141% nominal growth in budget-outlook revenue from 2013 to the 2027 forecast, compared with approximately 19% population growth. That does not contradict the spending chart simply because the percentages differ. It measures revenue, uses a different endpoint, and does not adjust the revenue line for inflation.
OFM’s current operating-budget overview uses approximately $163.853B for all funds and $74.125B for General Fund–State expenditures in 2025–27. Those measures cannot be substituted for the slide’s $80.2B NGF-O endpoint. All funds, General Fund–State and funds subject to the outlook cover different accounts; original and revised appropriations also differ.
Slide 04 / 11
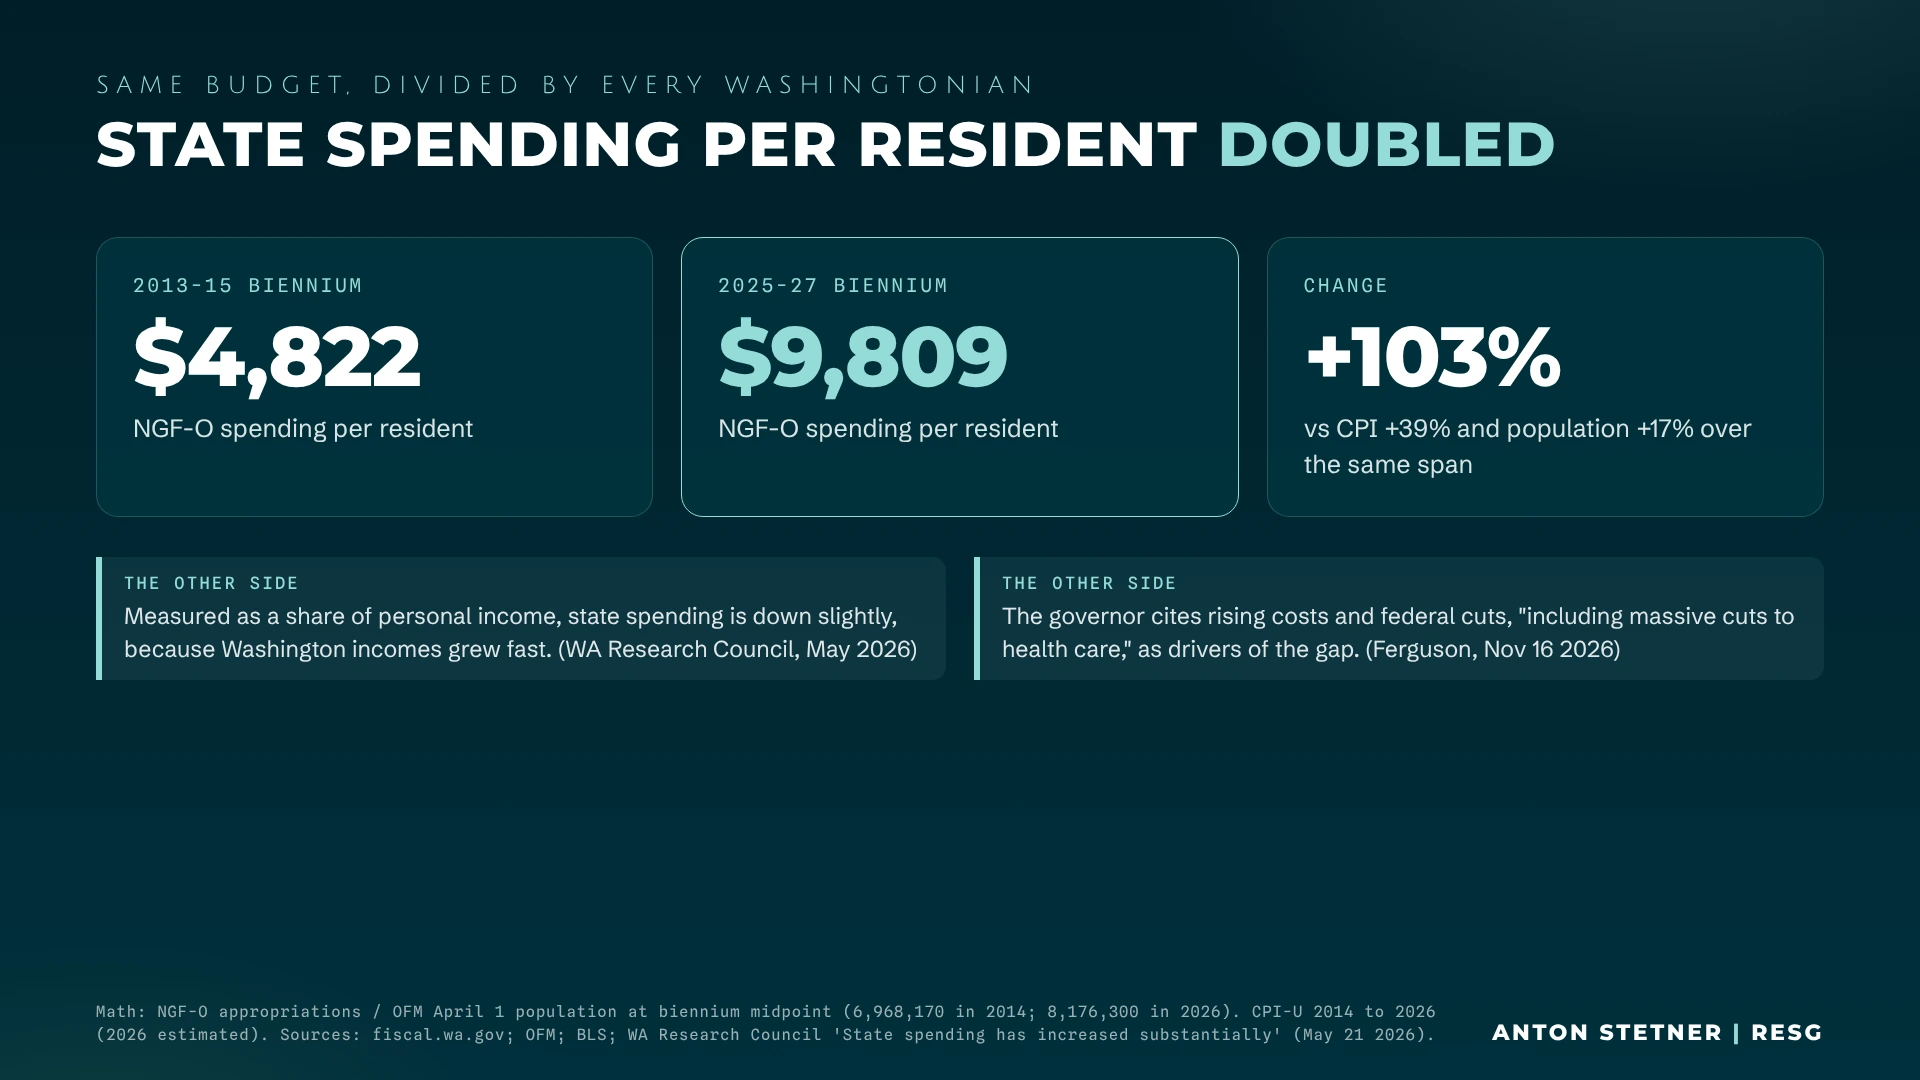
The same budget, divided by Washington’s residents.
Per-resident spending puts the budget on a household-sized scale. The slide compares approximately $4,822 per resident in the 2013–15 biennium with $9,809 in 2025–27, an increase of about 103%.
What is included in that comparison
These are two-year spending amounts divided by population, expressed in nominal dollars. They are not annual tax bills, individual benefits, or the amount each resident personally paid. Over the slide’s comparison span, CPI rises about 39% and population about 17%.
The research separately cites Washington Research Council’s estimate of 77.2% inflation-adjusted spending growth. Inflation-adjusted total spending, nominal spending per resident and spending as a share of personal income measure different things. Each needs its own denominator and period.
Why the competing perspective matters
The slide includes the Research Council’s observation that spending as a share of personal income was slightly lower because Washington incomes grew quickly. A growing state can afford a larger budget without that budget necessarily consuming a larger share of total income.
Ferguson emphasizes rising service costs and federal cuts. Critics emphasize whether permanent commitments outran sustainable resources. Population and CPI provide a starting point, but health-care costs, caseloads, compensation and new services can change differently from general consumer prices. Explaining those choices requires more than a single growth percentage.
Slide 05 / 11
The gap arrives before the income-tax cash.
Washington’s new income tax and Washington’s immediate budget gap operate on different calendars. The Department of Revenue says the 9.9% tax begins January 1, 2028, with the first returns due in April 2029.
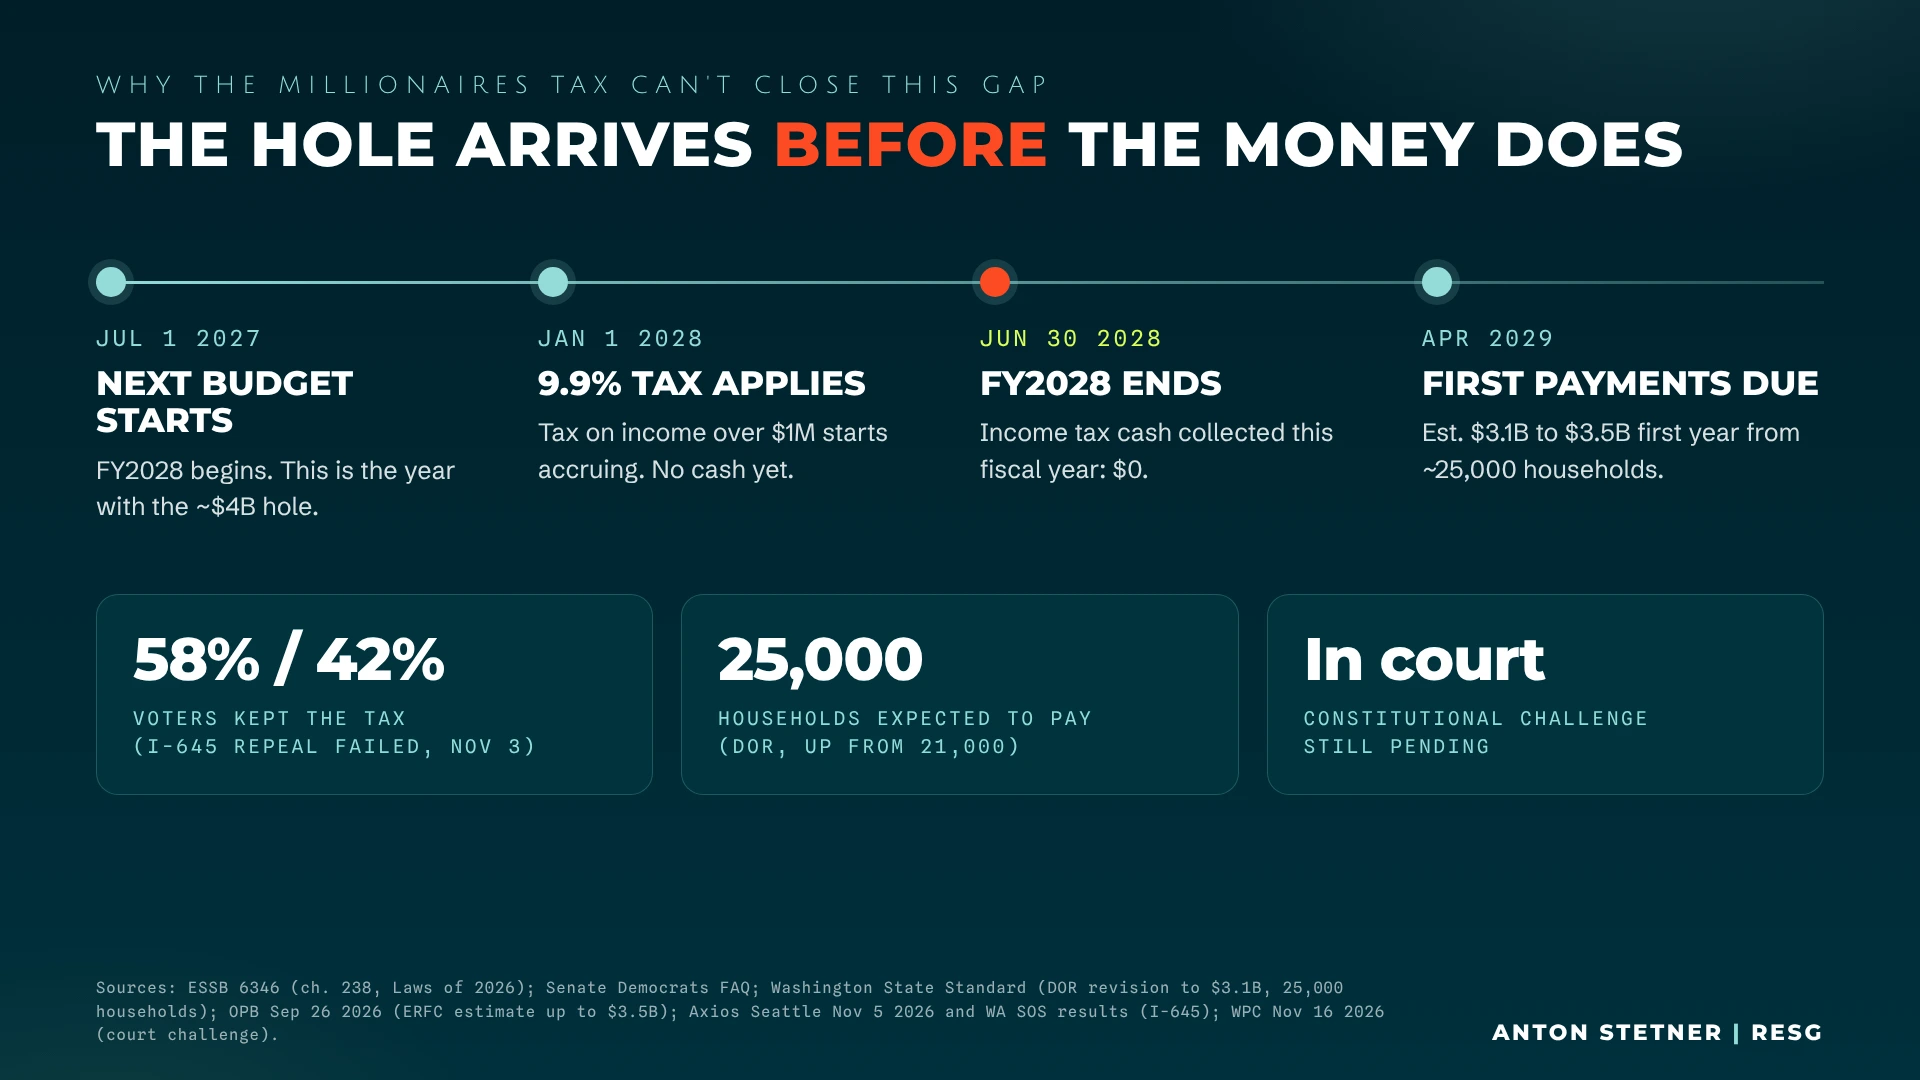
Reading note. Clarification to the slide’s $0: the timing claim concerns income-tax collections before spring 2029. The full legislative package can have costs or revenue reductions before those collections begin.
| Date | Event | Budget significance |
|---|---|---|
| March 2026 | Income-tax legislation signed | Enactment precedes collections. |
| July 1, 2027 | 2027–29 budget begins | FY2028 begins with the near-term gap. |
| January 1, 2028 | First tax year begins | Income becomes subject to the new tax; this is not the first major payment date. |
| June 30, 2028 | FY2028 ends | The fiscal year closes before the first returns are due. |
| April 2029 | First returns due | The first major payments arrive in FY2029. |
| July 2029 | Estimated prepayments begin under the fiscal note | A later payment cycle, outside FY2028. |
Gross revenue and the entire package differ
The original slide quotes roughly $3.1B–$3.5B in first-year receipts from about 25,000 households, reflecting later estimates cited in the research. The November 17 outline also records the enactment-era fiscal note: approximately negative $52M in FY2028 and positive $2.35B in FY2029, or about $2.30B for the 2027–29 package, versus roughly $2.70B in gross income-tax receipts.
Those are different forecast vintages and different measures. Tax relief, credits and other package provisions affect net receipts, while administrative spending is separately estimated in the fiscal note. The original fiscal note is not automatically the latest forecast. None of these estimates supplies FY2028 with payments due in April 2029.
The tax threshold and the election
The 9.9% rate applies to taxable income above the applicable deduction, rather than to every dollar of a qualifying household’s income. Individual circumstances, exclusions, credits and future guidance matter. Use the Department of Revenue’s instructions for actual planning.
The slide rounds the I-645 repeal vote to 58% No and 42% Yes. The research links the reported defeat of repeal and the Secretary of State’s results. That rounded episode snapshot is not a certified final tally. Repeal failing at the ballot box is also distinct from the legal challenge noted in the research; a pending case is not a ruling invalidating the law.
Slide 06 / 11
State taxes and Seattle fees accumulate on different ledgers.
The slide combines state revenue measures with local permit and rental fees. They all matter to budgets, but they cover different jurisdictions, tax bases, fiscal periods and stages of adoption.
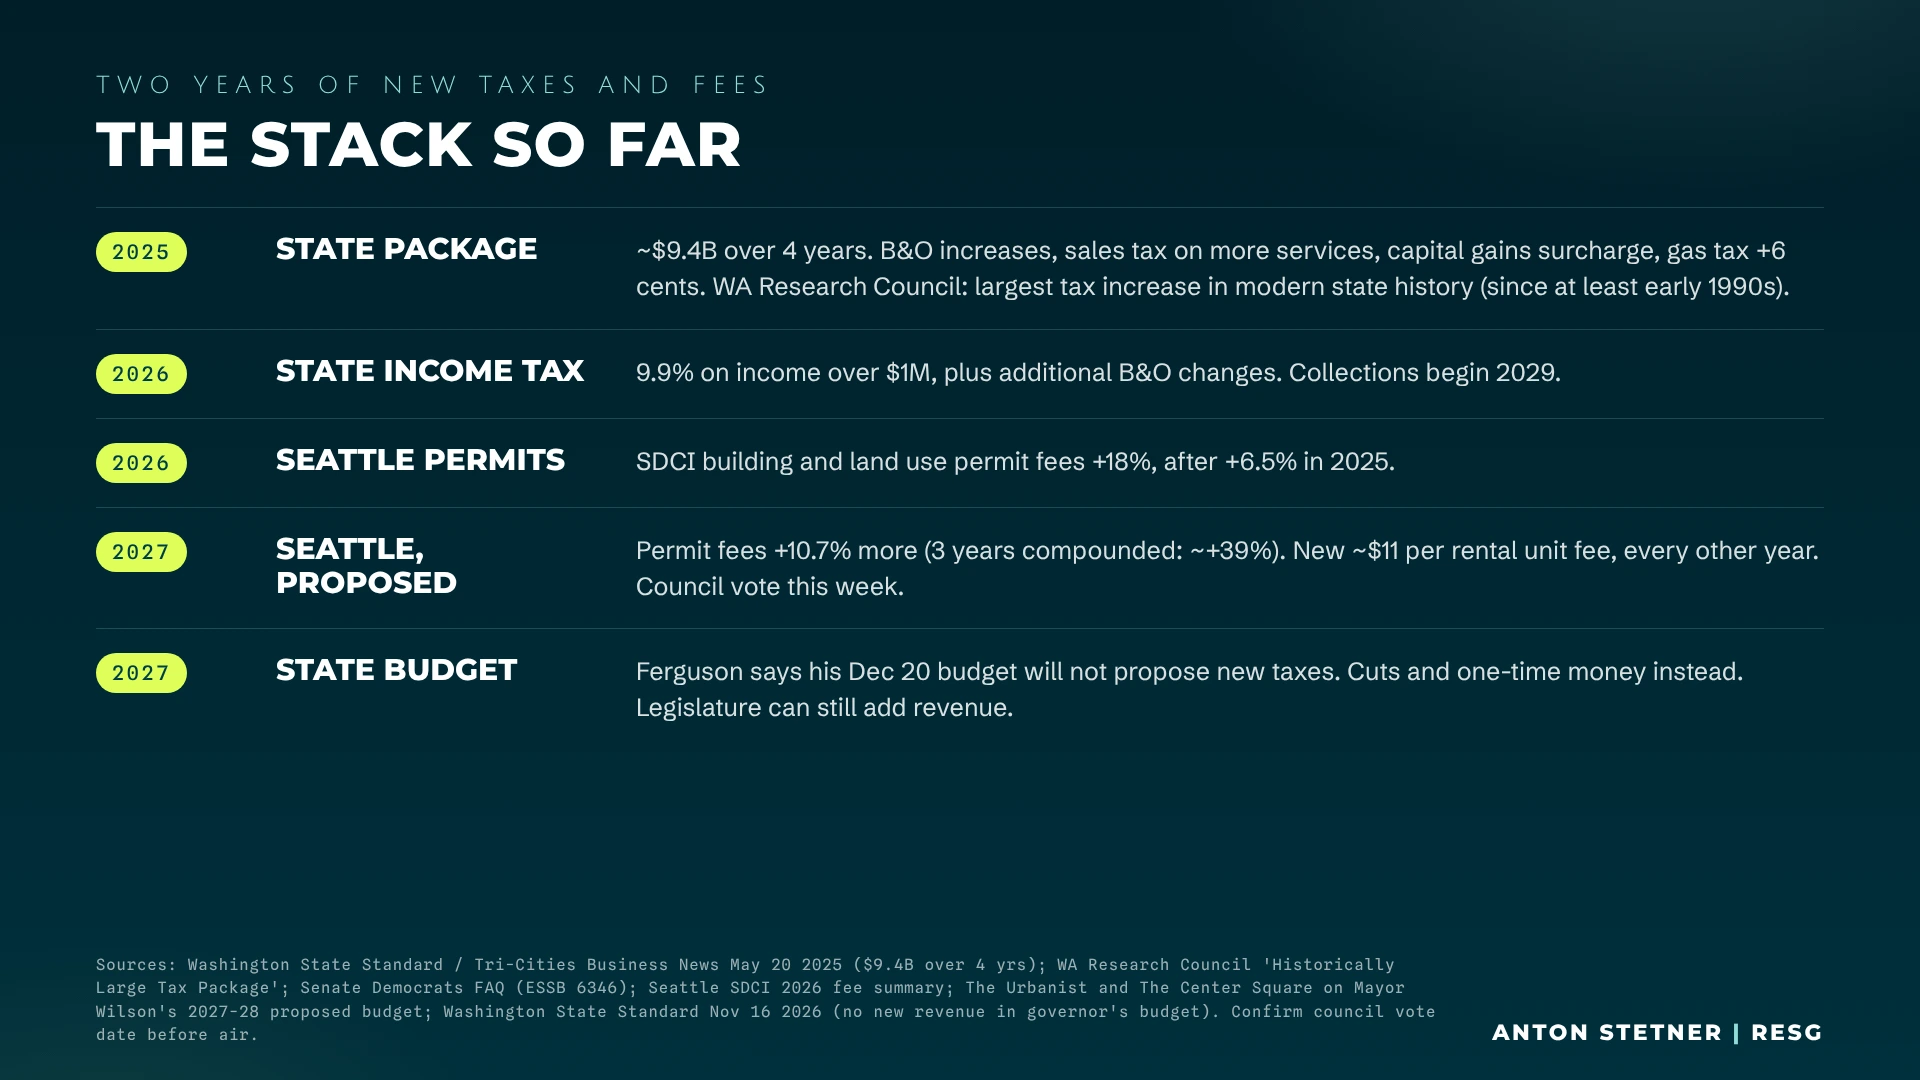
The 2025 state package
The episode’s research describes B&O increases, sales tax on more services, capital-gains and estate-tax changes, financial-institution and high-revenue surcharges, and transportation revenue including a six-cent gas-tax increase in 2025. Not every household or business pays every item.
Washington Research Council estimated about $3.6B in operating-budget tax increases in 2025–27 and $5.4B in 2027–29, totaling about $9.0B across four years. The initial research also cites reporting near $9.4B. Scope and forecast differences matter; those amounts should not be added together.
The Research Council calls the combined operating and transportation package the largest increase in modern state history under its inflation-adjusted first-full-biennium comparison, with records going back to at least the early 1990s. That is the organization’s defined comparison. Its approximately $8.9B first-full-biennium measure is distinct from the $9.0B four-year operating total.
Seattle permitting and rental expenses
The slide lists permit-fee increases of 6.5% in 2025, 18% in 2026 and a proposed 10.7% in 2027. Compounding those percentages gives approximately 39.1%, rather than the 35.2% obtained by adding them. Different permits can have different actual charges, so this is a comparison of the stated general increases, not a quote for a particular project.
The episode also describes a proposed fee of about $11 per rental unit every other year, in addition to RRIO registration. Its research lists RRIO at $126 per property plus $31.50 for each additional unit. Check the city’s current schedule, exemptions and adopted ordinance for an actual property. The planned council vote was not confirmed in the research, so the new fee and 2027 increase are described here as proposals.
A local fee does not directly fill the state operating-budget gap. It does affect the same owners and businesses dealing with state taxes. Whether a landlord can pass a cost into rent depends on the lease, applicable law and market conditions; a fee is not an automatic dollar-for-dollar rent increase.
Where the other episode sources fit
The Tax Foundation’s State Tax Competitiveness Index compares tax structures across multiple categories. Its 2027 edition places Washington 47th overall. That is a ranking under the Foundation’s methodology, not a tax-bill estimate or a measure of total household affordability.
TradingView’s U.S. 10-year Treasury chart and Mortgage News Daily belong alongside the financing discussion. Treasury yields help describe the rate environment; mortgage rates also depend on mortgage-backed securities, spreads, loan characteristics and lender pricing. Neither source establishes that Washington’s budget shortfall caused a particular mortgage-rate move. Their pages update, so this article does not label today’s displayed rate as the rate from the livestream.
Slide 07 / 11
Could taxable value be tied to the price you paid?
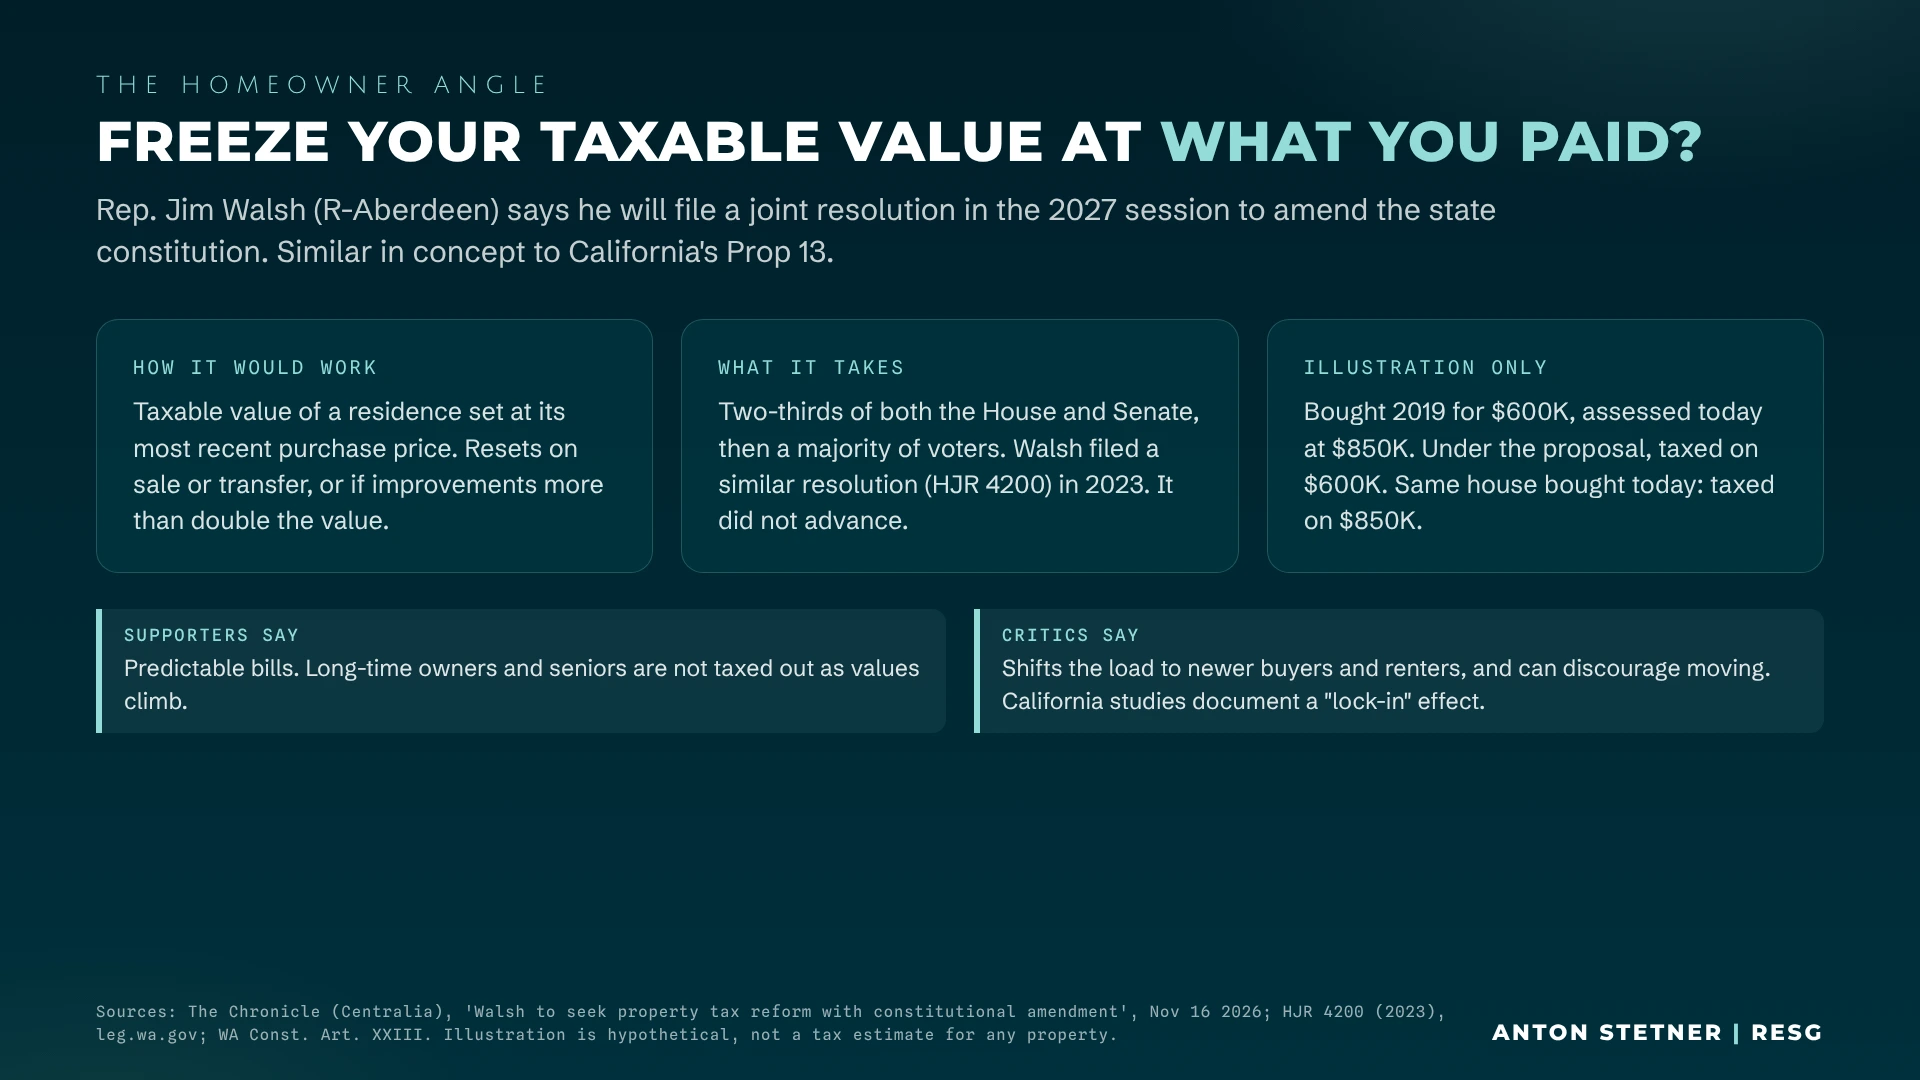
The homeowner slide examines Rep. Jim Walsh’s reported plan for a constitutional amendment that would tie a residence’s taxable value to its most recent purchase price. It is a proposal for a future session, rather than an existing statewide purchase-price freeze.
The proposed mechanics
As described in the research, taxable value would reset on a sale or transfer, or if improvements more than doubled the value. A constitutional amendment requires two-thirds support in both legislative chambers followed by majority approval from voters. The linked 2023 HJR 4200 supplies historical context; it is not proof that an identical 2027 measure has passed.
The slide’s example is hypothetical: one household bought a home in 2019 for $600,000, while its current assessment is $850,000. Under the described proposal, the longtime owner would use the purchase-price base, while someone buying the same house today for $850,000 would start with the newer price.
A valuation example is not a tax-savings quote
The $250,000 difference is a change in the hypothetical taxable-value base. It does not establish a specific reduction in dollars owed. Levy rates, exemptions, district boundaries, voter-approved measures and the final amendment language would all matter.
Supporters argue purchase-price treatment gives longtime owners and seniors more predictable bills. Critics argue it can shift burdens toward newer buyers and renters and discourage households from moving. Those are policy tradeoffs, not a recommendation that a particular household buy, sell or stay based on an unpassed proposal.
Slide 08 / 11
People and income can move in different directions.
A state can gain residents while experiencing a net outflow of income in tax-return migration records. The important task is to identify which population, period and income measure a particular number represents.
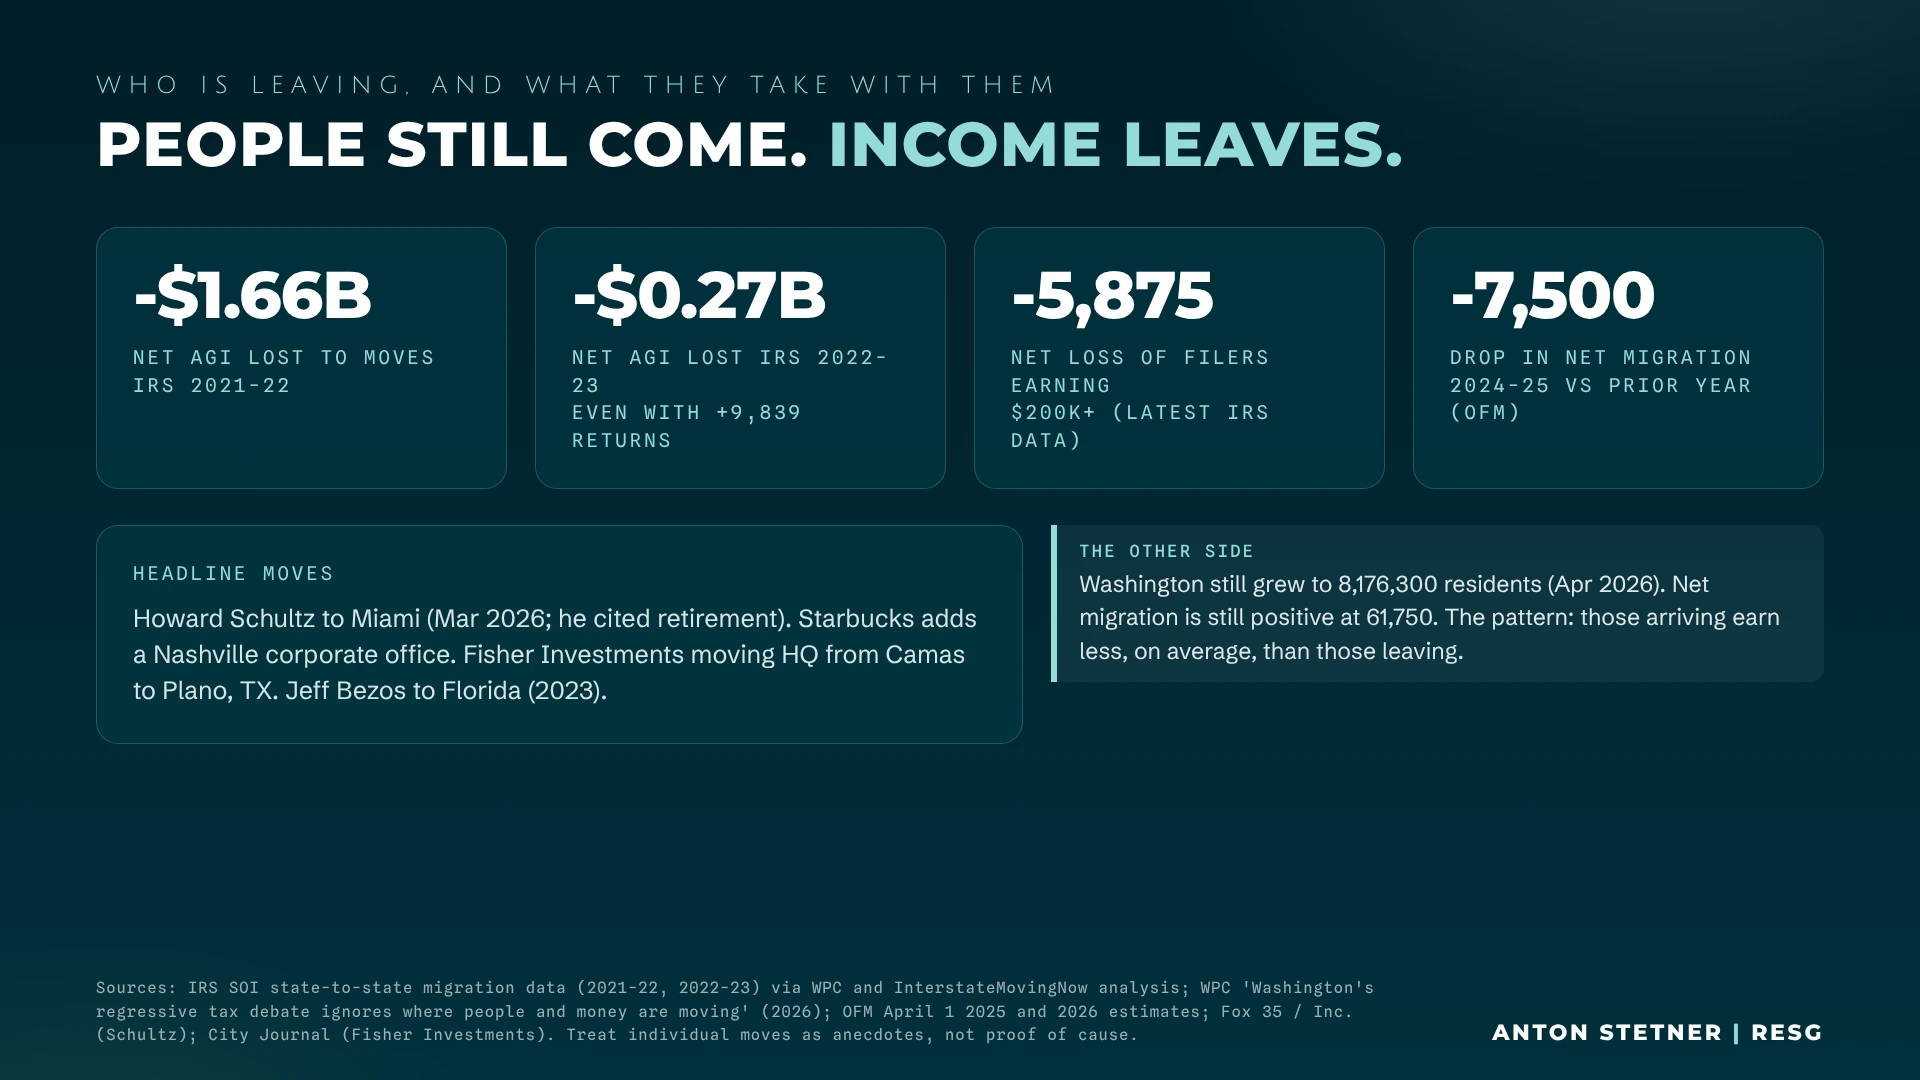
| Measure | Period | Reported result |
|---|---|---|
| Net interstate adjusted gross income | 2021–22 | Approximately −$1.66B |
| Net interstate adjusted gross income | 2022–23 | Approximately −$265M, rounded to −$0.27B on the slide |
| Net interstate tax returns | 2022–23 | +9,839 |
| Individuals represented in interstate returns | 2022–23 | −29 |
| Net migration to Washington | 2024–25, OFM measure | 61,750; about 7,500 below the prior year |
| Washington population | April 1, 2026 | 8,176,300 |
What the data support
The November 17 research describes departing returns with higher average adjusted gross income than arriving returns. That helps explain how the state could gain returns while losing net income in 2022–23. Tax returns, exemptions or represented individuals, and statewide population estimates are different units.
The slide also cites a net loss of 5,875 filers earning $200,000 or more through WPC. Its short label does not fully identify the period or aggregation, so it should not be combined with the single-year 2022–23 totals as if it were the same cohort. The IRS tables and AWB analysis provide the underlying comparison to examine.
These records do not establish why each person moved. The 2022–23 observations predate the new 9.9% tax. They cannot demonstrate that a tax taking effect in 2028 caused those earlier moves, and a lower annual net inflow is not the same as an overall population decline.
Company moves are evidence with limits
Fisher Investments explicitly tied its headquarters relocation announcement to Washington tax policy. Jeff Bezos publicly described family and Blue Origin reasons for moving to Florida, and the episode’s research says Howard Schultz cited retirement in his Miami move. Starbucks’ Nashville office expansion is another business-location development, not proof that every Washington job moved.
The outline also cites BLS Business Employment Dynamics showing roughly 5,900 net private-job gains in 2026 Q1 despite substantial gains and losses among individual establishments. A relocation announcement, a survey of possible moves and a statewide net-employment measure answer different questions.
For real estate, the practical concern is the durability of the local income and employment base. The evidence supports watching that base carefully; it does not by itself predict a housing crash or prove a single cause for migration.
Slide 09 / 11
One-time money can create an ongoing obligation.
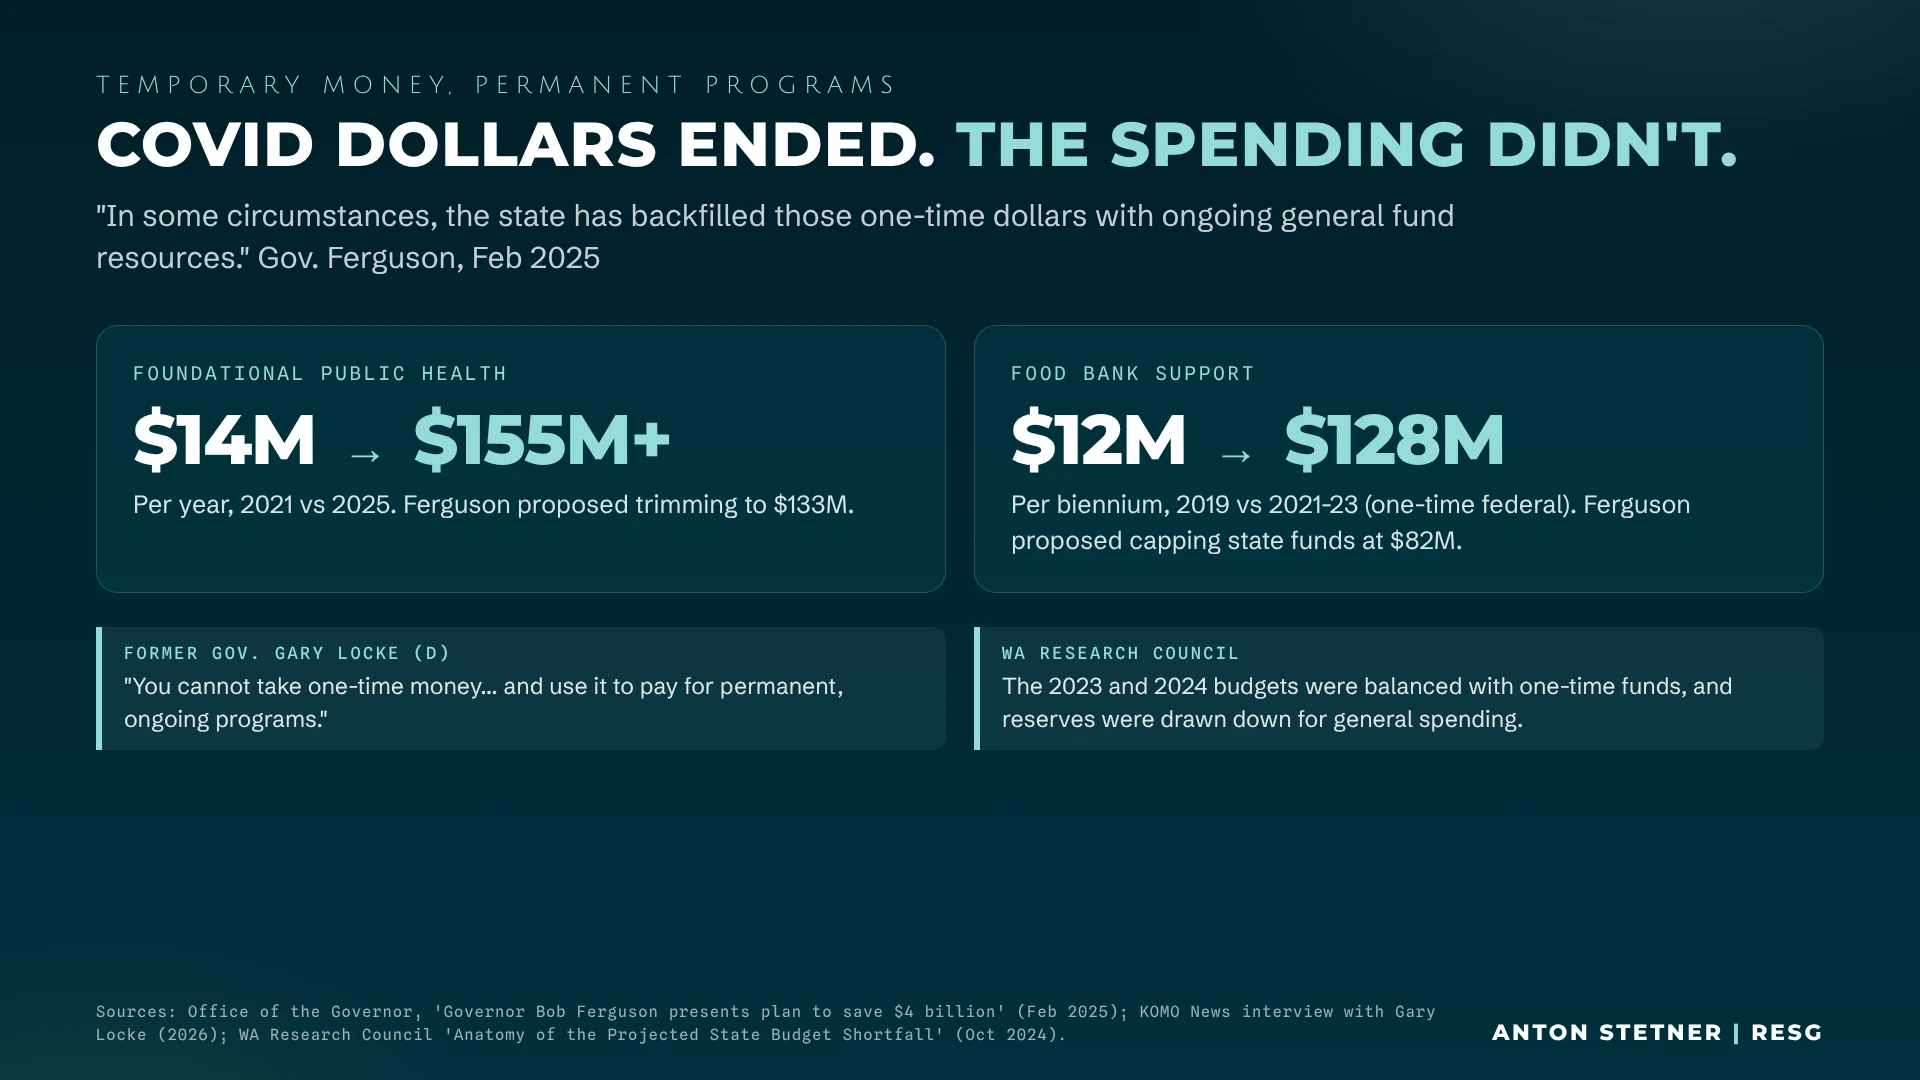
The episode’s structural-budget argument is about what happens after temporary funding supports services, staffing and public expectations. When federal support expires, continuing a service requires another source of money or a change in the service itself.
The examples on the slide
The original research compares foundational public-health support of about $14M a year in 2021 with more than $155M a year, and says Ferguson proposed a level near $133M. Its food-bank example compares about $12M per biennium in 2019 with $128M of one-time federal support in 2021–23 and a proposed state cap of $82M.
The denominators matter: annual public-health amounts and biennial food-bank amounts should not be added together. A proposed cap is also different from an adopted appropriation. These examples illustrate a funding transition; the source documents and enacted budgets establish the actual program totals.
The mechanism and the competing priorities
The November 17 outline also identifies school meals, child-care subsidies, the Fair Start for Kids Act, hunger relief and public-health capacity as areas to examine individually. The argument is not that every federal pandemic program became permanent. Major federal pandemic unemployment programs ended.
Ferguson’s February 2025 savings proposal acknowledges state backfills for some one-time federal resources. Former Gov. Gary Locke’s criticism, cited in the research, is that recurring programs need recurring funding. Supporters of continued services can reasonably argue that needs persist after a temporary grant expires. The budget question is what should continue and how to pay for it sustainably.
Using reserves can bridge a temporary disruption. Using one-time transfers repeatedly to finance a recurring gap postpones the decision. That distinction is central to the Research Council’s analysis of earlier budgets and reserve drawdowns.
Slide 10 / 11
Separate proven losses, recoveries and payments auditors could not verify.
The oversight story is serious enough without adding unlike figures or calling every unsupported payment fraud. The research distinguishes unemployment misappropriation, questionable costs, documentation failures and actual recovery efforts.
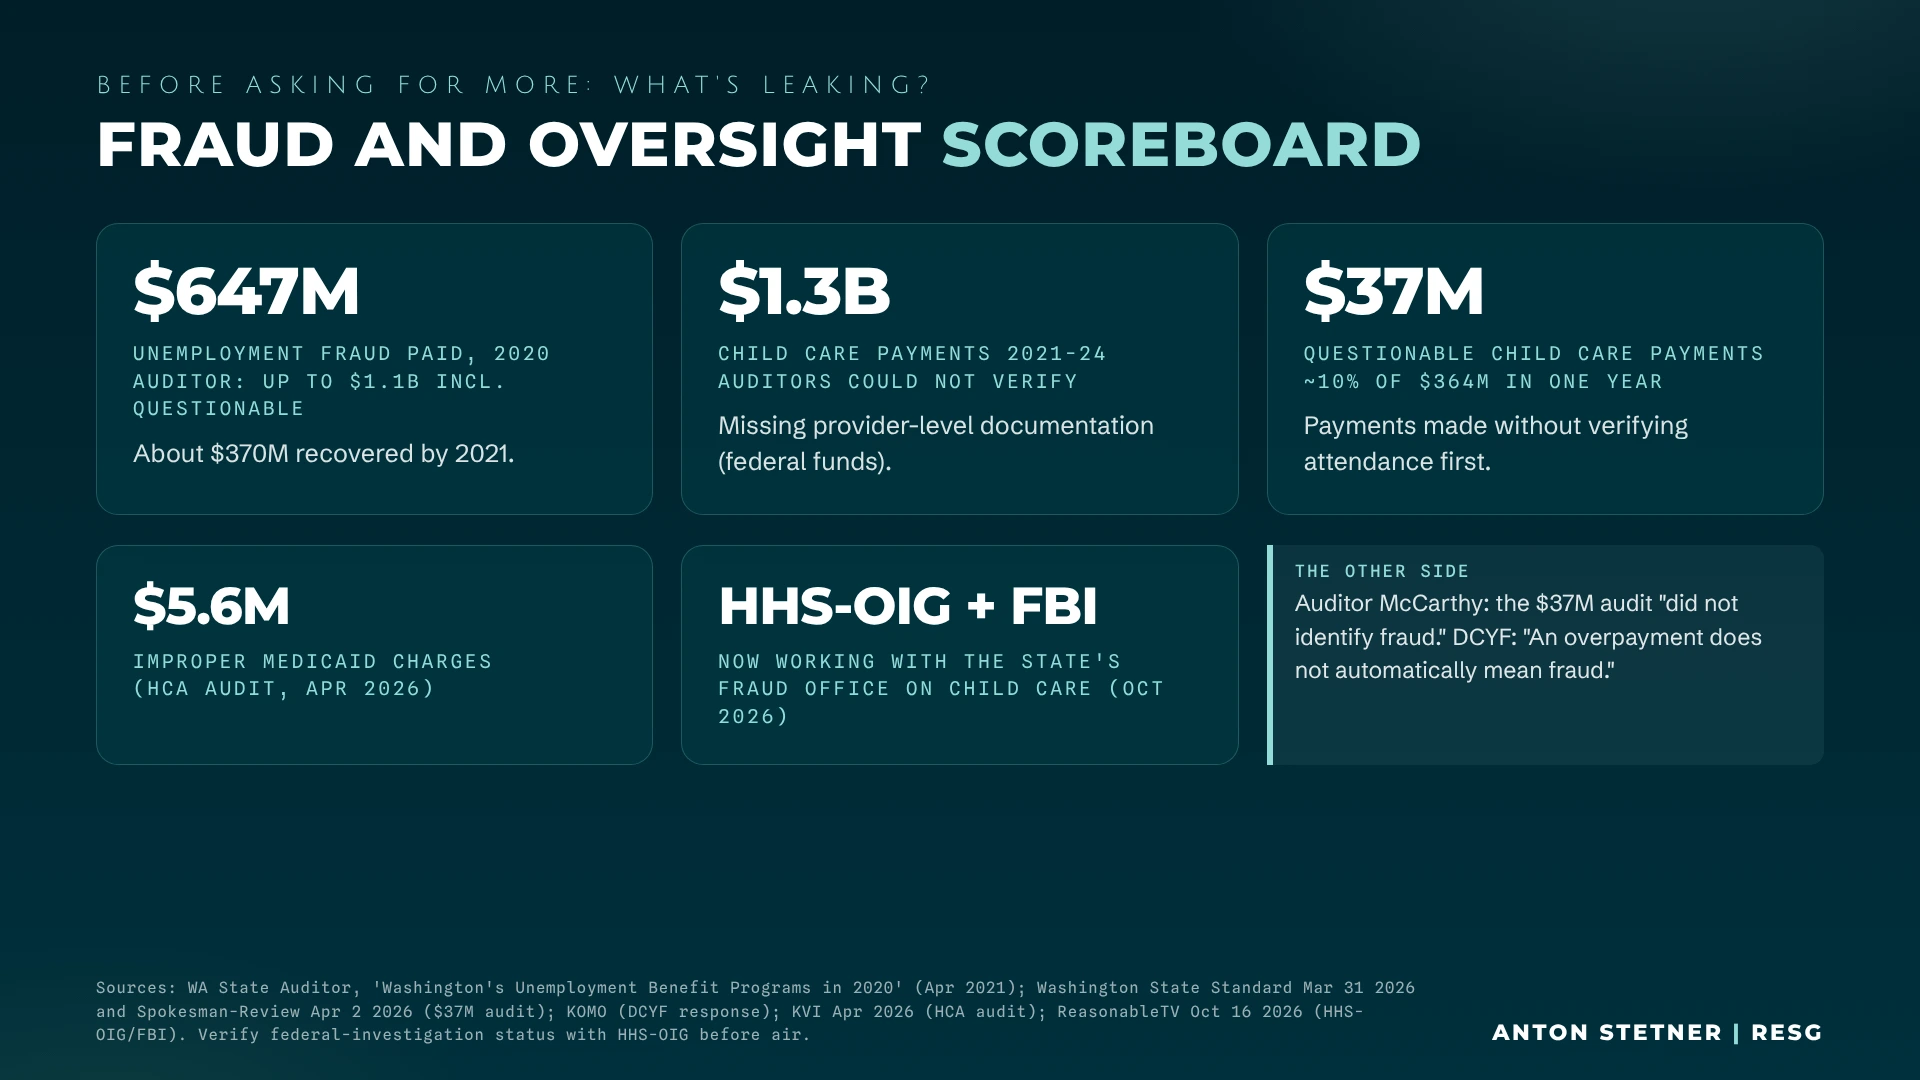
Reading note. The original slide remains available in full. Use the dated recovery update and these distinctions when quoting its numbers.
| Item | Research figure | Meaning / limit |
|---|---|---|
| 2020 unemployment misappropriation | $646.8M | Identified misappropriation, rounded to $647M on the slide. |
| Additional questionable unemployment payments | $460.5M | Flagged separately; not all established as fraud. |
| Unemployment recoveries by December 2024 | More than $432.6M | Later research update; the slide’s roughly $370M is an earlier snapshot. |
| Difference from initially identified loss | Roughly $214M | Approximate arithmetic at that recovery date, before later recoveries or revisions. |
| Child-care costs questioned or unauditable | $271M / $268.5M / $356M / $416M | FY2021 / FY2022 / FY2023 / FY2024; approximately $1.3B combined, not proven fraud. |
| Questionable child-care payments | Approximately $37.1M | Separate audit estimate; overlaps or methods may differ from the multi-year figure. |
| Improper Medicaid charges | $5.6M cited in the initial research | Secondary-reporting claim; a primary finding was not independently verified for this article. |
What the recovery update changes
It would be inaccurate to say authorities have pursued none of the fraud. The later outline records recoveries, prosecutions, settlements and stronger controls. A recovery total is dated evidence, not a permanent statement of the outstanding balance.
The slide’s statement that unemployment losses could reach $1.1B includes questionable payments alongside identified misappropriation. It should not be read as $1.1B in separately proven fraud, nor added to the $647M figure as another loss.
What questioned child-care costs mean
Missing attendance records, insufficient documentation, noncompliance and unsupported reimbursements can lead auditors to question costs. Intentional deception requires additional evidence. The research records the auditor’s statement that the $37M audit did not identify fraud and DCYF’s explanation that an overpayment is not automatically fraud.
The slide also mentions HHS-OIG and the FBI. The original research explicitly marked that report for corroboration. The linked ReasonableTV item is retained as a research lead, but federal involvement is not presented here as an independently established fact. The $5.6M Medicaid item is likewise attributed to its secondary source.
These figures span different years, programs and methods. Adding them to claim a recoverable fund sufficient to close the current $4B gap would confuse past losses, unverified documentation, possible overlap and future budget resources.
Slide 11 / 11
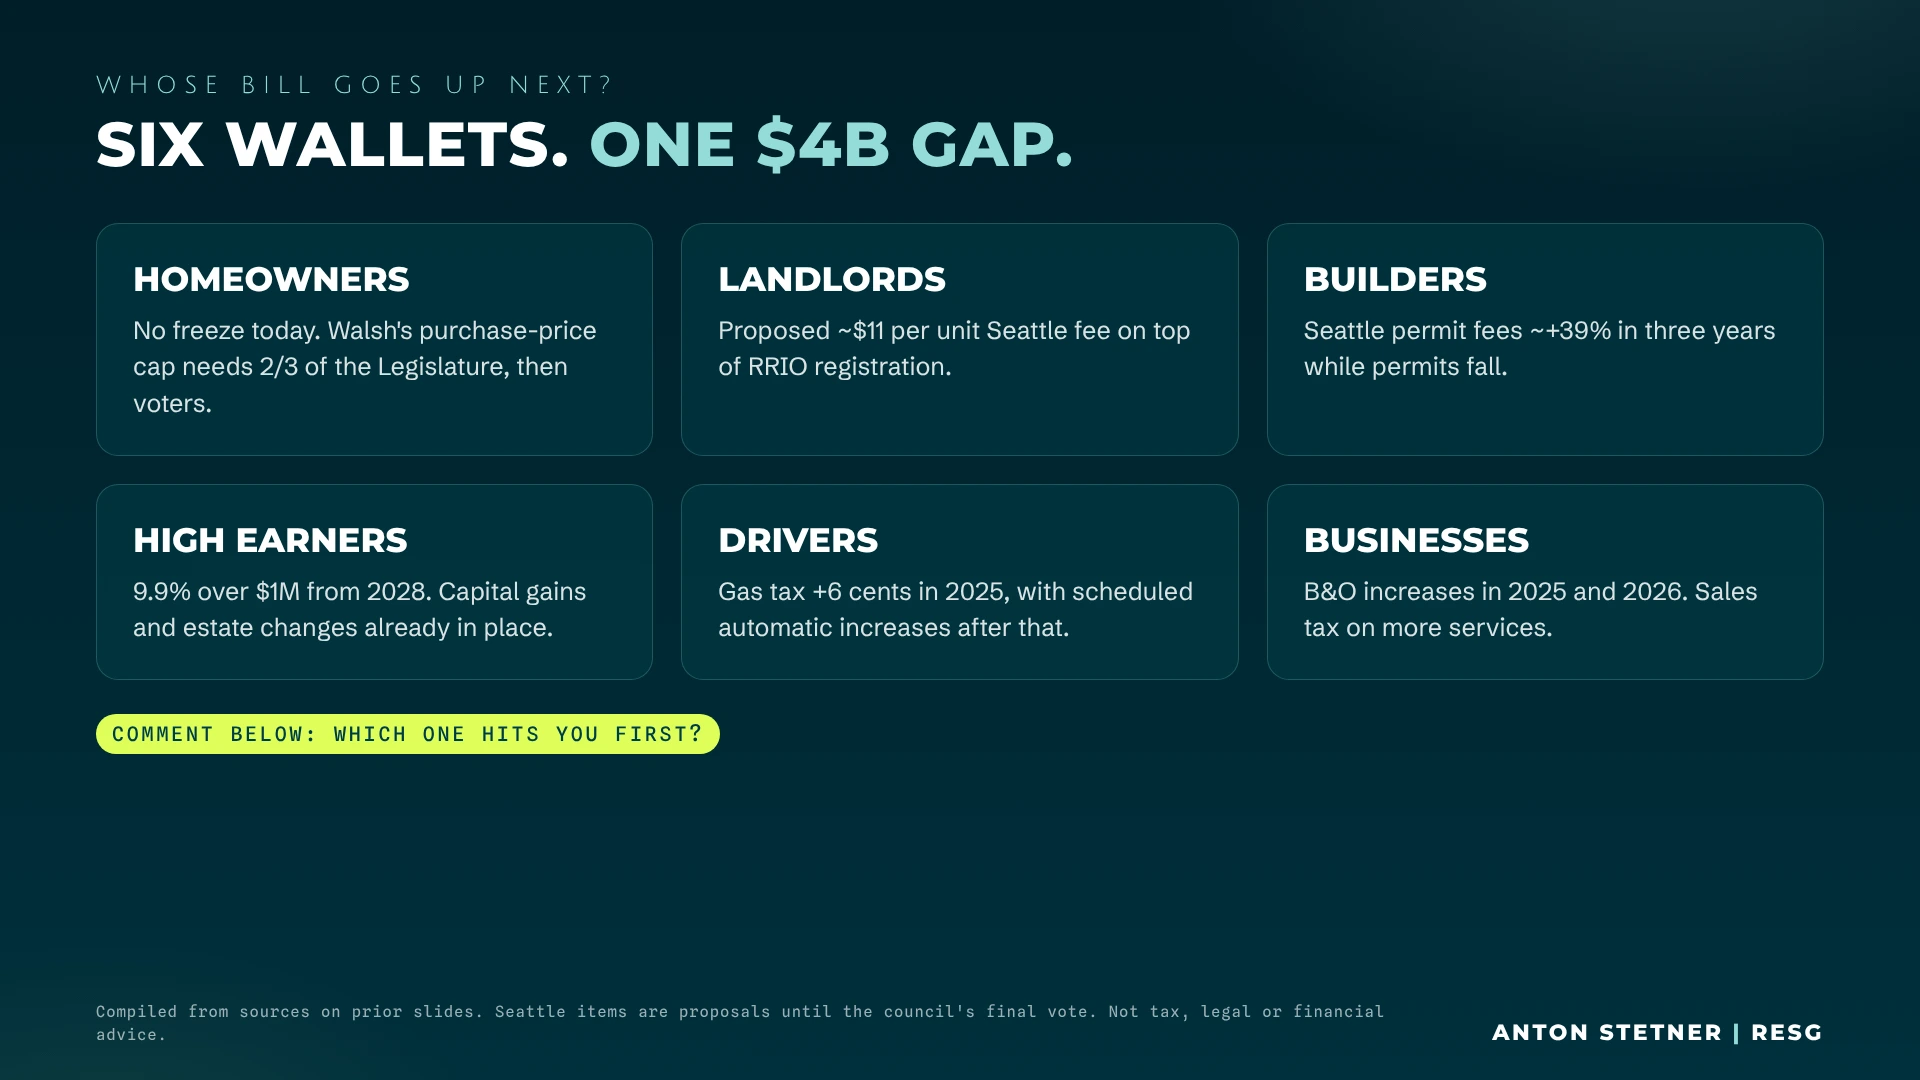
Six wallets. One budget debate.
The state can reduce commitments, change services, use reserves, shift costs, raise revenue or combine those choices. The effect on a household depends on which policies are adopted and which parts of that household’s budget are exposed.
| Who | What to watch | A useful next step |
|---|---|---|
| Homeowners | Local levies, ownership costs and any future valuation amendment | Review your actual assessment, levy districts and available relief; there is no enacted purchase-price freeze in this proposal. |
| Landlords | Seattle rental fees, taxes, insurance and service costs | Use an operating budget and the adopted fee schedule; assess lease and legal limits before assuming a rent change. |
| Builders | Permit schedules, financing costs, processing time and demand | Price the actual jurisdiction’s fees and carry costs for a specific project. |
| High earners | The 2028 income-tax start, deductions, credits and court developments | Model your circumstances with qualified tax advisers using current DOR guidance. |
| Drivers | Fuel taxes and transportation charges | Separate adopted charges from possible future proposals and your own fuel use. |
| Businesses | B&O, sales-tax coverage, surcharges, employment and location choices | Check the tax classification, effective date and exemptions that apply to your activity. |
What to watch next
The immediate milestones are agencies’ November 23 submissions, the governor’s proposal by December 20 and the 2027 legislative session. A proposal becomes a household cost only through its actual adoption, effective date and application to that household.
For buyers and sellers, connect this policy discussion to a complete monthly budget: financing, taxes, insurance, maintenance and an income cushion. For investors and builders, add operating expenses, permitting, vacancy, financing and contingency. Statewide headlines are context for a property decision; the property’s numbers and your circumstances still control.
Anton’s editorial question
The episode asks whether Washington will align ongoing commitments with sustainable revenue or return to households and businesses for another round of payments. That is a policy question. The article’s evidence distinguishes the scale of the problem from the choice of remedy, and the original livestream supplies Anton’s full commentary.