01 / The layoff reality
The job headlines matter. So does the hiring that never happens.
The risk reaches beyond the person who gets a pink slip. A buyer who still has a job can put a move on hold because the next round feels possible. A household expecting a new offer, promotion or stock-funded down payment may decide to wait. That is the confidence channel: fear, uncertainty and doubt can slow decisions before a mortgage becomes delinquent.
| Measure | Reported figure | Comparison |
|---|---|---|
| Tech cuts, YTD | 165,925 | +54% YoY |
| All cuts, YTD | 573,195 | −39% YoY |
| All cuts, September | 43,281 | Lowest September since 2022 |
| AI cited as reason, YTD | 120,136 | About 21% of all cuts |
| September hiring plans | 90,787 | Lowest September since 2011 |
Challenger’s October 1 report tracks announcements and employers’ stated reasons, not a count of completed local job losses. A tech-heavy slowdown can coexist with growth elsewhere.
Keep the geography straight.
The supplied research attributes a net loss of 18,605 jobs located in Seattle since 2024 to the Downtown Seattle Association, alongside gains of 5,375 in Bellevue and 662 in Tacoma. That is an all-sector net employment change from an advocacy organization, not 18,605 tech layoffs. The research also cites more than 11,000 Washington tech workers losing jobs from May 2025 to April 2026 and 9,027 workers on King County-area layoff notices through August 18, with 6,766 in information. These overlapping measures must not be added together. DSA reporting via KUOW; King County employment via Axios.
Named Washington cuts in the supplied research
| Employer | Workers | Scope / qualification |
|---|---|---|
| Amazon, January filing | 2,198 | WA; 1,407 Seattle / 626 Bellevue |
| Amazon, August filing | 121 | Seattle, Bellevue and Sumner |
| Meta | 1,395 | Washington; about 20% of local workforce |
| Oracle | 850 | Two Washington rounds |
| Microsoft | 605 | 493 Redmond / 112 remote |
| Microsoft / Xbox | 268–about 300 | OPB and KOMO figures conflict |
| Bungie | 292 | Supplied 2026 local compilation |
| Expeditors | About 230 | Supplied 2026 local compilation |
| Expedia | 162 | Supplied 2026 local compilation |
| Qualtrics | 117 | Supplied 2026 local compilation |
| Uber | 93 | Supplied 2026 local compilation |
| Zillow | 91 | Supplied 2026 local compilation |
| T-Mobile | 77 | Supplied 2026 local compilation |
| TikTok | 75 | Supplied 2026 local compilation |
| Salesforce | 59 | Supplied 2026 local compilation |
| 52 | Supplied 2026 local compilation |
Attribution: Washington ESD WARN filings as reported by FOX 13, OPB, KOMO and Axios; see the full source directory. Company-wide cuts by Seattle-area companies—30,000+ in 2025, Amazon’s 30,000 since October 2025 and Microsoft’s 15,000+ in 2025—are not all local. WARN notices describe planned layoffs and may change.
Companies cite AI investment, fewer management layers and corrections to pandemic hiring. The housing implication is broader than the announced cuts: weaker hiring can reduce relocation demand and move-up confidence. The research does not measure those channels directly, so they are mechanisms to watch rather than proven local totals.
| Measure | Year earlier | August 2026 |
|---|---|---|
| Unemployment rate, seasonally adjusted | 4.6% | 4.9% |
| Long-term unemployed | 35,200 | 60,600 |
| Long-term share of job seekers | 19.8% | 28.3% |
| U.S. unemployment rate | — | 4.1% |
Washington ESD Facts and Figures. Statewide measures do not isolate Seattle homeowners. Rehiring speed matters because a short income interruption and a prolonged one create different housing decisions.
02 / From a layoff to a home price
Five ways job uncertainty can reach housing.
- Relocation slows. Fewer new local offers can mean fewer incoming buyers. No migration dataset in this package establishes the size of that effect.
- Career moves pause. A job switch, raise or new commute can prompt a housing move. Holding onto a current job can also mean staying in a current home.
- Stock wealth feels less certain. Compensation and a down payment can be exposed to the same company. Historical tech-wealth research supports a connection, but this package does not measure Seattle RSU-funded purchases.
- The move-up buyer waits. The household considering a larger payment may choose to preserve flexibility. That can affect both its purchase and the listing it would have supplied.
- Inventory accumulates. Slower contracts let listings build. The outcome depends on whether sellers can wait or need to accept the next offer.
“It’s not the people who get fired. It’s everyone who gets nervous.”
Anton’s October 8 thesis. Relocation, career mobility and move-up behavior are hypotheses here; the research does not quantify their local effect.
03 / The housing freeze
Fewer deals. More choices. Prices moving more slowly.
| Metric | 2025 | 2026 | Change |
|---|---|---|---|
| New listings | 2,809 | 3,102 | +10.4% |
| Pending sales | 1,772 | 1,543 | −12.9% |
| Closed sales | 1,602 | 1,320 | −17.6% |
| Homes for sale | 4,687 | 6,005 | +28.1% |
| Months of supply | 3.0 | 4.1 | +1.1 months |
| Median sale price | $971,726 | $950,000 | −2.2% |
| Days on market | 32 | 33 | +3.1% |
| List price received | 99.1% | 98.4% | −0.7 percentage points |
Closings fell 17.6%; the median fell 2.2%. That gap supports the freeze thesis. Year-to-date residential pending sales were down 7.2%, closings down 7.0% and the median down 3.1%. The September median comparison is year over year, not month over month. NWMLS prices do not account for concessions or down payment assistance; net terms can differ from the reported sale price.
King County condos
September pending sales fell 23.3%, closings fell 31.0%, and supply rose from 4.6 to 6.5 months. The $514,950 median was down 1.9% year over year. The YTD median was $530,000, down 7.8%.
Seattle city
The supplied city summary reports 3,658 active homes, up 15.9%; 732 pendings, down 13.1%; and an all-type median of $840,000, down 1.2%. Its residential-only median is $924,950, down 2.5%.
Madrona Group’s October 5 summary of NWMLS / InfoSparks; a separate geography and filter from King County.
Don’t flatten the region into one market.
| County | Median | Price YoY | Active YoY | Pending YoY | Supply |
|---|---|---|---|---|---|
| King | $845,000 | −3.4% | +30.0% | −8.4% | 4.3 months |
| Snohomish | $724,500 | −4.0% | +39.3% | −7.8% | 3.6 months |
| Pierce | $589,000 | +1.6% | +21.1% | −14.8% | 3.3 months |
NWMLS August Recaps. Pierce’s positive median and weaker contracts allow more than one explanation; this table does not prove a migration or affordability effect.
The supplied June Eastside figures put the single-family median near $1.6 million, down 3.1%, and the condo median at $690,500, down 11.5%. Those are historical context, not September Bellevue or Kirkland results. Large swings in a high-dollar submarket’s median can reflect which homes sold. September city figures still need to be supplied before replacing this context.
The Redfin metro ranking in the script refers to July (pending sales −15.6%) and a four-week window ending September 13 (−20.3%). Those are different windows and geographies; neither establishes September’s full-month national ranking.
04 / Where the pressure concentrates
New construction deserves a closer look.
A homeowner’s ability to wait differs from a builder’s carrying-cost clock. Seattle’s supplied city summary reports new construction pendings down 38.0% and inventory up 46.1%. Its separate resale pending comparison is down 1.8%. Confirm the exact property filters before treating those as a matched residential-only comparison. The county exports below explicitly filter new construction, residential.
| Metric | King 2025 → 2026 | King change | Snohomish 2025 → 2026 | Snohomish change |
|---|---|---|---|---|
| Homes for sale | 990 → 1,094 | +10.5% | 328 → 493 | +50.3% |
| New listings | 448 → 480 | +7.1% | 121 → 158 | +30.6% |
| Supply, based on pendings | 4.9 → 5.9 months | +1.0 month | 2.5 → 4.8 months | +2.3 months |
| Monthly median sale price | $1,132,858 → $997,493 | −11.9% | $733,715 → $664,995 | −9.4% |
Both counties have roughly twice September 2023’s new construction inventory: King rose from 563 to 1,094 and Snohomish from 254 to 493. Their September supply readings are the highest in the supplied January 2023–September 2026 series. That creates a reason to compare completed homes, carrying costs and incentives carefully.
View the January–September comparison and three-year context
| Measure | King 2025 → 2026 | Change | Snohomish 2025 → 2026 | Change |
|---|---|---|---|---|
| New listings, summed | 3,183 → 3,451 | +8.4% | 1,457 → 1,435 | −1.5% |
| Inventory, monthly average | 778 → 950 | +22.1% | 323 → 412 | +27.4% |
| Supply, monthly average | 4.2 → 4.9 months | +0.7 months | 2.4 → 3.8 months | +1.4 months |
| Average of monthly medians | $1,045,337 → $976,093 | −6.6% | $794,008 → $706,307 | −11.0% |
| Measure | King | Snohomish |
|---|---|---|
| Homes for sale | 563 → 1,094 (+94%) | 254 → 493 (+94%) |
| New listings | 263 → 480 (+83%) | 181 → 158 (−13%) |
| Pending-based supply | 2.7 → 5.9 months | 1.8 → 4.8 months |
| Monthly median | $929,900 → $997,493 (+7.3%) | $789,990 → $664,995 (−15.8%) |
The price summary is not a true YTD median or a same-home appreciation measure. King’s September 2025 median was unusually high. Inventory is a stock; new listings are a flow. The supplied county exports do not include pending or closed sale counts. No Pierce or Kitsap new construction results are inferred.
05 / The forced-seller question
A foreclosure increase is not the same as a foreclosure wave.
ATTOM reports 2,482 Washington properties with foreclosure filings in the first half of 2026, up 40.94% year over year. That is about 0.08% of housing units, or 1 in 1,332, placing Washington 40th among states. A large percentage increase from a small base needs both numbers beside it. ATTOM’s midyear report.
| Measure | Historical period | 2026 period |
|---|---|---|
| U.S. housing units with filings | 2.23% · full year 2010 | 0.16% · January–June 2026 |
| U.S. properties with filings | 2.87 million · full year 2010 | 227,548 · January–June 2026 |
| Washington housing units with filings | 1 in 413 · August 2010 only | 1 in 1,332 · January–June 2026 |
| Washington state rank | 14th · August 2010 reporting | 40th · January–June 2026 |
Filings include default notices, scheduled auctions and bank repossessions; they are not only completed foreclosures. The Washington historical rate is secondary RealtyTrac reporting and remains archive-unverified. One month versus six months, and a full year versus a half year, are not directly comparable. Doubling a half-year rate would be a rough illustration, not an actual annual count.
Cheap existing mortgages can slow turnover.
The package’s FHFA-based summaries put about half of outstanding mortgages at or below 4% and nearly 78% below 6% in Q1 2026. These are national shares, not Seattle-specific. They help explain why replacing an existing loan can be costly. Equity and a manageable payment may give an owner options, but neither guarantees protection from job loss or foreclosure. Mortgage lock-in can reduce supply and demand at the same time.
06 / What research can answer
A job shock is not a crash calculator.
Blanchard and Katz’s 1992 research describes relative housing-price responses to modeled regional employment shocks, with a trough several years later. The package’s roughly 2% response over four to five years is not a universal result for any size layoff, and it cannot be converted into a number of Seattle workers. Shock size, place and model all matter. Read the original paper.
The San Francisco Fed’s historical California analysis connects tech stock wealth with housing prices, including an estimated 1%–2% housing response over two years to a 10% tech-wealth increase. It is context for the wealth channel, not a symmetric prediction for a 2026 Seattle decline. Read the Fed research. The package also includes IPO, local-spending, negative-shock and supply-constraint research in the source directory.
The 2022–2023 lesson: employment and financing overlap.
The supplied Seattle Case-Shiller seasonally adjusted series declined about 12% from April 2022 to March 2023 while mortgage rates moved from roughly 3% toward 7% and tech layoffs grew. That history shows multiple pressures arriving together. It does not isolate how much of the correction came from rates or employment. Case-Shiller is a repeat-sales index; the NWMLS medians above describe the mix of transactions.
Watch income, payment pressure and forced selling together. A layoff headline alone cannot tell you the next sale price.
07 / The money got more expensive
Run the payment before you run after the discount.
Freddie Mac’s October 1, 2026 30-year average was 7.28%, compared with 7.03% a week earlier and 6.34% a year earlier. This is a dated survey benchmark, not today’s personalized quote. The package separately reports MBA’s 7.49% contract rate for the week ending October 2. Different surveys measure different loan samples. Freddie Mac release; MBA release.
| Rate scenario | Rate | Monthly P&I |
|---|---|---|
| Year-ago Freddie Mac benchmark | 6.34% | $4,724 |
| Prior-week Freddie Mac benchmark | 7.03% | $5,072 |
| October 1 Freddie Mac benchmark | 7.28% | $5,200 |
| MBA benchmark in supplied package | 7.49% | $5,309 |
At the same price and down payment, the October 1 benchmark adds about $476 per month against the year-ago rate. The one-week move from 7.03% to 7.28% adds about $128. Taxes, insurance, HOA and any mortgage insurance come on top.
Rate outlook and forecast limits
The package reports a 10-year Treasury intraday reading above 5.3%, rising mortgage spreads, applications down 4.2% week over week and an ARM application share of 10.3%. These are dated market context, not loan recommendations. Treasury yields do not map to mortgage rates with a fixed spread.
It lists Capital Economics at 6.25% for 30-year mortgages by end-2027 and Barclays at 5.25% for the 10-year in Q3 2027, with lower Treasury views from Bank of America and Goldman. Mortgage forecasts and Treasury forecasts are different measures. Earlier 2026 mortgage forecasts ranged from 5.75% to 6.6% and are stale. Build a decision that remains affordable if rates do not improve.
Run your own numbers
Price, payment, or both?
Start with the episode example, then use your lender’s quote. Calculations run in this page; there is no submission form.
Illustrative two-year subsidy: $17,938. This is the sum of the monthly payment differences, before lender fees or other closing costs.
30-year amortization; principal and interest only. Excludes taxes, insurance, HOA, mortgage insurance and closing costs. The price-cut comparison keeps the same down-payment percentage. A temporary buydown subsidizes payments without changing the note rate. Availability, funding, contribution limits and qualification require lender approval. Afford the full payment; do not assume a refinance.
08 / The fourth-quarter opportunity
Now is the time to get ready to buy—and negotiate.
For a buyer with stable income, adequate reserves and a workable full payment, heading into fourth quarter is a reason to act on preparation. Tour the competing homes. Get financing current. Compare builder incentives. Put a thoughtful offer together when the seller has fewer alternatives.
Best time to buy in the Seattle Metro: October leads, September is close.
Realtor.com’s 2026 Best Time to Buy report identifies October 18–24 for Seattle-Tacoma-Bellevue, three weeks after its national window of September 27–October 3. This metro covers King, Snohomish and Pierce counties. Its seasonal comparisons point to more choice, less listing-view demand and more time to negotiate.
| Measure | Historical seasonal comparison |
|---|---|
| Active listings | +31.9% versus an average week |
| Views per listing | −52.4% versus peak |
| Days on market | +22 days versus peak-season pace |
| Median listing price | −7.5% versus seasonal peak |
| New listings | +16.5% versus an average week |
Source: Realtor.com’s report, Seattle-Tacoma-Bellevue metro row. Listing views are a demand proxy, not a count of qualified competing buyers. These historical listing comparisons are not promised discounts on a particular home.
We reran the public data. The fall window holds up.
Our October 8 analysis of Realtor.com’s public metro listing and demand histories puts October first at 69.0 out of 100, with September second at 68.4. That 0.6-point gap is small. The practical takeaway is a September–October buying window, with October offering a useful opening for a prepared buyer.
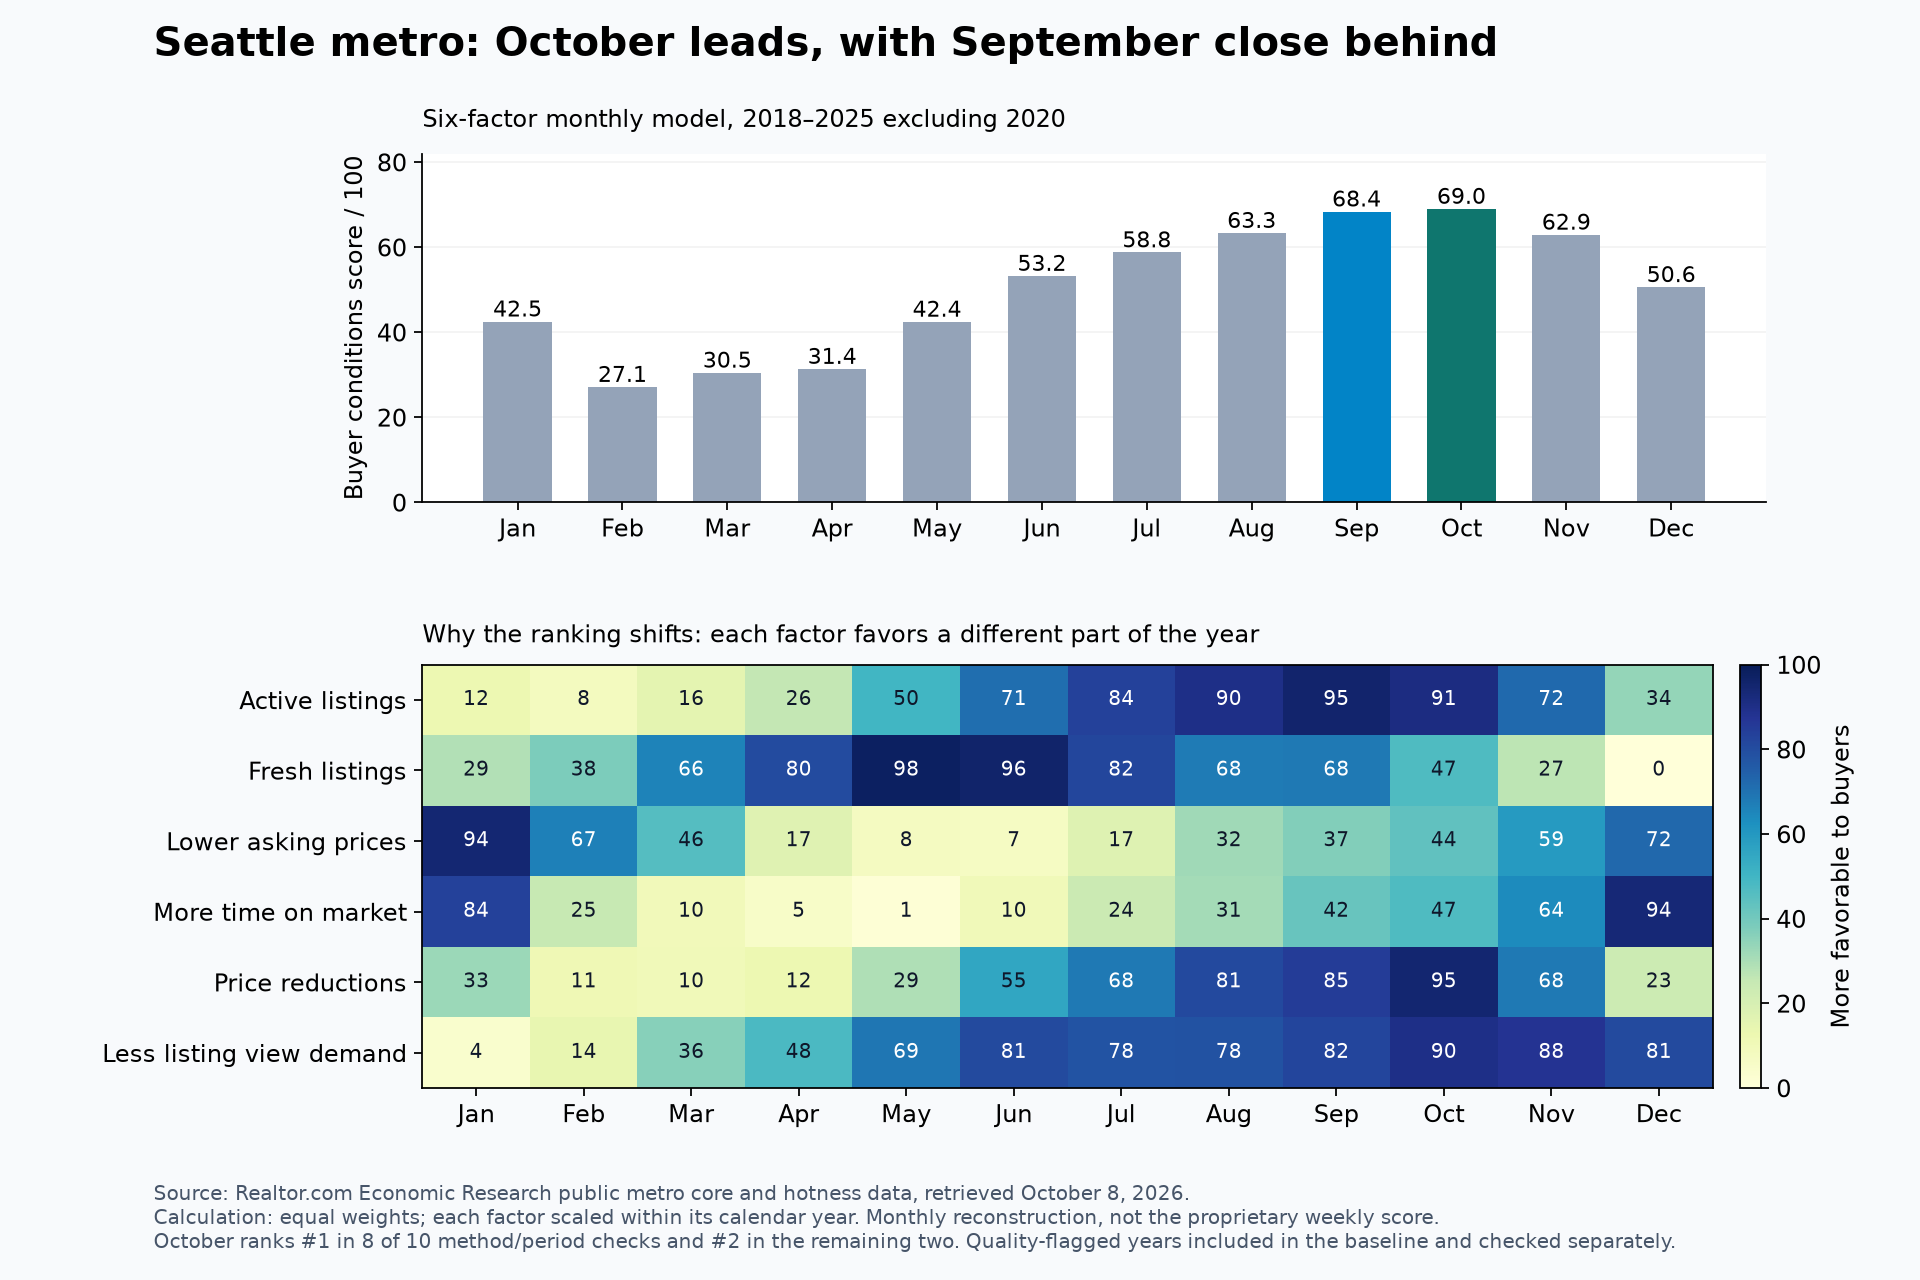
October stays near the top
October ranks first in 8 of 10 scoring and historical-period checks, and second in the other two. It ranks in the top three in 6 of the 7 individual years. That supports the window while leaving room for a different result in any particular year.
September 2026 listing snapshot
The frozen Realtor.com metro extract shows 13,078 active listings, 51 median days on market, and a $749,970 median asking price. These listing measures cover the metro, separate from the King County closed-sale median above.
Read the monthly scores, method and research files
| Month | Score | Rank |
|---|---|---|
| January | 42.5 | 8 |
| February | 27.1 | 12 |
| March | 30.5 | 11 |
| April | 31.4 | 10 |
| May | 42.4 | 9 |
| June | 53.2 | 6 |
| July | 58.8 | 5 |
| August | 63.3 | 3 |
| September | 68.4 | 2 |
| October | 69.0 | 1 |
| November | 62.9 | 4 |
| December | 50.6 | 7 |
The calculation uses 84 monthly observations across seven complete years, 2018–2025 excluding 2020. Within each year, six factors are scaled from 0 to 100: active listings, new listings, lower asking prices, longer market time, price-reduction share and lower views per property. Factors and years receive equal weight. Relative views are reconstructed from published month-over-month changes; they are not viewer counts.
Realtor.com’s weekly inputs and full scoring specification are not available in this packet. This monthly reconstruction cannot independently establish October 18–24 as a unique winning week. Source quality flags affect parts of 2022–2023; the baseline includes those months, with separate checks that exclude both years. Some choices put September or November first.
Core listing data run through September 2026; listing-view demand runs through August. The historical October profile averages about 31% more active listings than the year’s average, 43% fewer views than the annual peak, and median asking prices 4.9% below the annual peak. Those monthly figures differ from the publisher’s selected-week comparisons. Listing mix can change a median without the same home becoming cheaper.
Sources: Realtor.com Economic Research data and definitions, metro core history, and metro hotness history. Public histories may be revised; the downloads preserve the October 8 snapshot.
The best-week score excludes mortgage rates.
That makes it useful for timing the search and negotiation. It does not establish the week with the lowest monthly ownership cost. The seasonal result is a historical pattern, not an October discount promised on a particular home.
| Illustration | Price / rate | Monthly P&I |
|---|---|---|
| September King median at October 1 rate | $950,000 / 7.28% | $5,200 |
| Hypothetical 7.5% lower price | $878,750 / 7.28% | $4,810 |
| Year-ago King median and benchmark rate | $971,726 / 6.34% | $4,832 |
The hypothetical discount saves about $390 monthly; the 25-basis-point rate move adds about $128, roughly one-third of that amount. A price near $882,779 at 7.28% would match the earlier $4,832 principal-and-interest payment under these assumptions. That arithmetic is why a lower headline price can still bring a higher payment.
The 7.5% scenario crosses geography and measure: metro historical listing prices versus King County residential closed-sale medians. It is illustrative only; it uses the published weekly comparison, not our monthly reconstruction.
09 / Buyer playbook
Go where the terms give you room to breathe.
- Compare motivated inventory. Completed new construction, condos and longer-marketed homes deserve a look. Check comparable sales and total costs; time on market does not automatically mean distress.
- Negotiate credits as well as price. Ask your lender to compare closing-cost assistance, a permanent rate buydown and temporary payment relief. Confirm contribution limits before writing the offer.
- Discuss protections. Inspection, financing, appraisal and sale contingencies can change the risk of a purchase. Choose them with your agent based on the property and competition.
- Protect reserves. Keep room for income disruption, maintenance and the full monthly payment. A discount does not solve a fragile budget.
- Use a holding plan. Make the purchase work without a quick appreciation rebound or a guaranteed refinance.
Fourth quarter can be your opening to negotiate a better deal on the terms. Get ready now if your circumstances support buying. If you already have an agent, bring them this guide and the numbers you want to test.
10 / Seller playbook
Price for the buyers who are here today.
Use active competition and recent comparable sales, then adjust for condition, location and terms. Launch with presentation ready. The package’s Seattle showing statistic—3.1 showings per listing, down 22.5%—is a single-source signal; it is not a forecast for your home. Track your own showings, feedback and offers early.
A $20,000 price cut or a 2-1 buydown?
| Option | Seller concession / subsidy | Buyer monthly P&I | Duration |
|---|---|---|---|
| No concession | $0 | $5,200 | Full payment |
| $20,000 price cut | $20,000 | $5,091 | Lower price is permanent |
| 2-1 buydown, Year 1 | $17,938 total subsidy | $4,211 | First 12 months |
| 2-1 buydown, Year 2 | Included above | $4,694 | Next 12 months |
| 2-1 buydown, Year 3 onward | Subsidy ends | $5,200 | Full note-rate payment |
The example’s subsidy is about $17,938. It creates roughly $989 of monthly relief in year one and $506 in year two. The price cut saves about $109 a month while also reducing the purchase price and required down payment.
Early payment relief is different from permanent savings. A temporary buydown funds part of the scheduled payment; it does not permanently lower the note rate. The buyer must be able to handle the full payment. Fannie Mae requires qualification at the note rate. Your lender must confirm the program, credit caps, subsidy, fees and treatment of unused funds. This illustration has not been reviewed by a licensed lender. Fannie Mae rules.
11 / Investor playbook
Underwrite the cash flow at the financing you can actually get.
More choice does not automatically make a property a good investment. Use supported rents, vacancy, maintenance, management, taxes, insurance, HOA obligations and capital repairs. Stress-test a longer lease-up, a lower resale price and financing that stays expensive. For a development project, include extension costs and the exit lender’s requirements.
A low mortgage rate is not automatically transferable.
FHA, VA and some USDA loans can permit approved assumptions, subject to buyer eligibility and program rules. Occupancy restrictions can make them unsuitable for an investor’s rental acquisition. Covering the seller’s equity is a separate capital requirement. VA transactions also need release-of-liability and entitlement review. Most conventional loans have due-on-sale provisions.
Seller carry can finance part of a purchase through a note and security instrument. Subject-to and wrap structures do not erase the underlying lender’s rights. Have a Washington real estate attorney and licensed lender evaluate an actual transaction. Builder construction debt is not treated here as an assumable residential mortgage.
12 / Business-owner playbook
Buy the opportunity without draining the business.
If you own a business, tech uncertainty may reach you through customers, payroll, receivables and your own household income. The page’s housing data does not establish commercial property pricing, but the need to preserve operating flexibility applies to a home purchase, rental investment or business-use property.
- Separate the cash buckets. Distinguish personal down payment and reserves from payroll, tax obligations and working capital.
- Stress-test the combined exposure. Model softer revenue and slower collections alongside the full property payment. Avoid counting the same reserve twice.
- Match the property to its use. Compare ownership, leasing and postponing based on duration, use permissions, tenant needs and actual financing.
- Choose terms that protect runway. Price, credits, diligence time and loan structure each affect cash flow differently.
- Coordinate the professionals. Review title and entity choices with your attorney, tax effects with your CPA, and qualification with the lender before committing.
13 / The episode
The discussion behind this guide.
Watch Anton and Benji work through the layoffs, the housing freeze, financing and the fourth-quarter opportunity. Published October 9, 2026 · The Anton Stetner Podcast.
Press Play to watch · 58:11 · Watch on YouTube ↗ · Read the full transcript ↓
The player loads automatically with autoplay off. Your browser may connect to YouTube/Google before you press Play, sharing your IP address and browser information; playback activity may also be shared. Google’s Privacy Policy applies.
Full video transcript
The actual YouTube auto-generated captions are below, grouped into readable paragraphs. Caption wording is retained and may contain errors in names, numbers and punctuation. The conversation includes the speakers’ opinions and anecdotes; use the sourced article above for figures, definitions and limitations.
9,273 words · 1,403 caption entries · Complete available captions, from 0:00 through 58:08, for the 58:11 recording.
Select a time range to read it. Paragraph timestamps open the corresponding moment on YouTube.
0:00–5:00 Read transcript
0:00 ↗Welcome to the Anton Stener podcast. Today I have one question for you. How many more tech bros are going to get fired in the Seattle area? Because I'm hearing a lot of people getting laid off. They're leaving Seattle and Washington state. It's kind of crazy what's happening right now, Anton. Uh the city of Seattle uh there was data that was just released that said they posted 18,65 fewer jobs than they did in 2024. You know, literally just a year ago. And Seattle is is showing a sharp drop in pending home sales. And so what
0:41 ↗everyone's literally been asking is like, hey, if we have tech workers, and we know our tech workers are some of our highest paid employees, and we know tech represents like 22% of the GDP here in Washington state, like how many tech workers have to get laid off before prices get dramatically affected or possibly even crash? And this was this came in as a question that was essentially worded from the audience. I was like, "Oh my goodness, that's such a good question. We want to make sure that we that we answer this."
1:13 ↗And so we went and did the real research because it's not always what people think, and we'll give it to you here in the next 20 minutes, what's actually happening with these layoffs and how many tech workers would have to be laid off in order to get a crash. But it's not the people necessarily getting fired. It's the ones that still have a job. And it's that rising fear, uncertainty, and doubt that causes people just to go and clam up and pause and not do anything. Like what do humans do when they're
1:46 ↗afraid? >> They don't do anything. They just stay still or maybe even like make uh brash decisions like without really thinking about long-term consequences. >> That's exactly what they do. They're they're in their emotions and so they'd rather not make a decision than to make the wrong decision. And on top of this, there is a type of property and it's not luxury properties here in the Seattle metro where pendings are down 38%. It's getting just freaking rocked, just crushed. And then realtor.com just said that this this week, like coming next week, starting on
2:26 ↗the 18th of October, is going to be the best time to buy in Seattle. We'll talk about that because that's only days away. All right. Well, let's jump into it. You know, uh it's always the question, right? When are we going to get to the crash that we've been waiting for now for 16 years? Uh it it's pretty depressing right now because winter's here, it's getting darker. It it's cold. I mean, literally, it's cold here in the podcast studio. But I think a lot of people are kind of depressed because
2:59 ↗there's there is a lot of uncertainty. I mean, what's what's uh what's every homeowner, buyer, investor asking right now? So I think yes there is uncertainty in the market and yes that the market has cooled and that fear, uncertainty and doubt that FUD is causing everyone to question what's going on. But I think we're also buying into these negative headlines a little bit. So I want to kind of break it down. Demand is freezing without major distress. Sellers aren't dumping their homes. Foreclosures are still at a historic low. Buyers that have jobs have great
3:45 ↗jobs. And on top of that, there's a second shock that no one is connecting inside of these stories. So, what we're going to do is we're going to look at the data first. We're going to talk about what matters to you, whether you're buying, you're selling, you're investing, or you're a real estate broker here. and we'll bring all of that essentially together. I'm Anton Steden. We've been selling real estate here since the early 2000s. We've sold thousands of homes during the great financial crisis. Everything was dropping like a rock and everyone's
4:24 ↗starting to trying to compare. Oh no, this is just like the GFC. This is nothing like the GFC. And we'll go through the data because we played that game during then. And there are is a playbook for buyers. There's a playbook for sellers. There's a playbook for investors right now. You can hit us up at rsg.com if you want to chat about that. >> Hit that subscribe button. Hit the hype button. We need more people to see these messages. >> And let's start talking about some of these layoffs and where we're at. Oh, I
4:56 ↗was just going to say though, I'm definitely one of those buyers, sellers
5:00–10:00 Read transcript
5:00 ↗even that's just frozen in place because, you know, I've been wanting to literally build a house for over 10 years. >> And I' I've been looking for property kind of knowing I wanted a a bigger house and that was before I had five kids. And a lot of people look at our family and see the size of my house, which is 2200 ft. I designed it very strategically so it could literally uh house us forever before we knew we were going to have five kids. So it's pretty tight in there and now you know like
5:29 ↗sometimes Judy's dad lives with us. >> But I don't want to sell or move or buy or even build >> because of interest rates. Yeah. >> So, if you put on top of it my kind of like anticipation for price drops because of especially these layoffs, I'm a good example of exactly what that like my psyche. And the thing is I'm probably more optimistic than most people. I was just kidding around about the weather even though I don't like the dark, cloudy, long winter of Washington State, Western Washington. But I know a lot of
6:03 ↗people are also like myself in terms of like, hey, I want to keep my low interest rate. >> Uh I I don't want to get into something double the price even if it I kind of need it, right? So they're like forcing just staying put. But then the the layoffs is what's crazy because the uh financial crazy the crisis, right? the layoffs started creating people having like uh lack of paying their mortgage which created short sales and forclosures and then then the price really dropped like by 30% I think in
6:37 ↗some areas. >> Yeah. So if you're talking about the GFC that was a that was a really big drop when you bring mortgages in that's one of the five pipes that we're going to talk about later that kind of fills out this story. When I dug into this data though about actual tech layoffs, I so I was like, man, these these headlines have to be scarier than they are. No, these headlines were actually kind of pretty real. Nationally, tech layoffs are up 54% this year. >> Wow. 165,925 US tech job cuts announced through
7:18 ↗February, up 54% from basically 108,000 a year earlier. Tech is 29% of all cuts. Now, I'm talking nationally right now. We'll come into the US in a second, but total US cuts were 43,281, the lowest since September of 2022. AI was cited in 120,000 of these cuts about 21%. So what you have is you have like a twotrack job market. Tech is bleeding and a lot of other jobs are fine. What's interesting when you prepare this research and you talk with the AI models, they're like they kind of say like, well, everyone else is fine. And I
8:00 ↗I disagree with that. I actually think a majority of the population is feeling financially pinched even if they feel like they have some decent job security. And you can see that in consumer sentiment reports. You can see that in the buyers, the sellers, the investors that we talk to, the small business owners that we talk to. People feel beat up. One of my business partners, I was talking to him last night and one of our other friends, which is also one of my business partners, he's like, "Oh, you heard uh we're like, "Oh, Mike just got
8:33 ↗another excavator." And I was like, "Does he need another excavator right now?" And my partner Tony is just a no, probably not. But he got it for like 50% off. >> Oh, wow. >> So, he's got a really big one and he's got a a skid steer, but you kind of need these mediumsiz ones. are like a 130 to like a 165 to do a lot of jobs and they can be moved around easily. >> I was going to say diesel uh vehicle owners are really hurting and all these uh heavy equipment are run off
9:06 ↗of diesel on diesel. >> So that's why people are really pinched because well they've got payments on these machines oftent times. Yes. >> Secondly, they're having less jobs probably. It's just slower in real estate. And then third, with diesel prices this high, I know that I I I went to Costco in Lynwood, Washington, right? Probably one of the busiest Costos, and the gas line was not busy. And I have never seen that at that Costco specifically. >> And I was thinking, I wonder if it's because not as many people are filling
9:38 ↗up. So, you know me as I'm reading, as I'm digging through everything, there is data right now that says the luxury consumer is consuming 1 to 2% more in gas. And the middle class and below is consuming like 2 to 5% less. In other words, gas is so expensive right now,
10:00–15:00 Read transcript
10:02 ↗people are actually pinching their gas. And what's funny was I when I read that, Benji, I have caught myself doing that. And here's what I mean. I just usually fill up on a regular basis, you know, when my schedule and it's like just every, you know, this, you know, Tuesday or whatever it is, I just fill up. I caught myself the other day. I was like, I'm going to drive her all the way to empty. It made no sense. I'm going to just drive it till the gas light comes all the way on because I actually didn't
10:29 ↗want to go to the pump and put my credit card in and see what the bill was. >> Yeah. So, and I I'm sure I'm not the only one. >> And you have to drive, >> right? Um, well, with that being said, I have a question to follow up this tech layoff stat. You said 544%, >> but does that mean in Seattle it'd be even more >> tech layoffs like percentage- wise since I think Seattle has done a little bit better? >> Okay. >> But we've had I mean quite a few here
10:58 ↗throughout Washington because the names are huge. You got Amazon had 2,198 uh workers laid off uh in January. They had 147 in Seattle, 626 in Belleview. That's on top of the 2,000 Seattle area job cuts that were back in October of 2025. You had Amazon again in Seattle, Belleview, and Sumar effective this October. You had almost 1,400 at Meta, which is about 20% of its workforce. 850 in two rounds at Oracle, 650 or 605 for Microsoft and Redmond, then roughly about 300 at Xbox, and then poor Bungie. Hey, any of my
11:41 ↗Halo players out there, my Bungie, my Bungie players, hit me up in the comments if you're a Halo fan. I Halo was like my first person shooter, the one I was in love with. But Bungie just had to lay off 292. uh Expediters 230, Expedia 162, Qualrix 117, Uber 93, Zillow 91, T-Mobile 77, Tik Tok 75, Salesforce 59, and Google 52. So this is a lot of big numbers. And we started out talking about the Seattle city itself has 18,65 fewer jobs than it did in 2024. So yes, tech is being hurt and tech is
12:26 ↗being hurt somewhat disproportionately, but Seattle proper is being decimated. Why? H ask yourself why. The activities of Seattle, the current policies of the mayor, the lack of dealing with crime is preventing the businesses from growing, the people from moving there. things are massively changing. And so you have all these groups that are coming out that are really pushing back against that. The downtown uh Seattle Association of Businesses, the DSA, not to be confused with the Democrat Socialist of America, but they are still in Seattle, so the name, you know, it
13:11 ↗sounds it sounds similar. >> Too much of a coincidence. >> Yeah. >> More tech specific numbers. Seattle area tech companies announced more than 30,000 job cuts in 2025, mostly from Microsoft, Amazon Blue Origin. Amazon alone cut 30,000 corporate jobs since 2025, about 10% of its corporate workforce. That was the largest cut in the history of Amazon. In Washington, more than 11,000 tech workers lost their jobs between 2025 and 2026. Only the state of California beat us with more. Okay. So this is not this is that concerning trend. This is the thing when we talk about when
13:53 ↗ideology meets economic reality. We are chasing away the golden goose known as tech. one of our clients right now, he he sent me an email last last night and I replied to him this morning and he has a electrical or HVAC business anyway, but he also worked for a tech company uh here locally and the tech company had to choose between Virginia and then Redmond, Washington. And in the 2000s, they chose Redmond, Washington. And then all of a sudden, things started very much changing. And so they they chose to just completely leave Washington state,
14:36 ↗but they also just didn't leave Washington state. They left the whole country. So what? So they felt like Seattle was the place to grow their little tech business. They grew their little tech business and then they felt like it became hostile to their product, their business, and they felt like, you know what, we're just going to move it straight out of the country. And I was reading that, I mean, on my phone this
15:00–20:00 Read transcript
15:00 ↗morning and I was like, how many more businesses, you know, I realize this is an anecdote, but how many more businesses are feeling that way? Because Janicki, for example, they're a large aerospace manufacturer. They're building their next facility out of state. King County had layoff notices of 9,027 dang >> workers. Oh, did I tell you this fun little story? I I don't know if that's fun or not. It's related to >> King County government. >> No. Go. >> So, I have an office in downtown Seattle. Yeah. >> It's a great time to get office space,
15:43 ↗by the way. Hit me up in the DMs if you you need some good office space. I'm like right in the heart of downtown. It's the cheapest I've I don't even know if I've told you how much I pay. It's like it's a great price and it it it's take your pick anywhere in downtown. Okay. But I'm in downtown quite often for business. I do station with the family sometimes and I'm literally just looking out the window and I'm always dumbfounded how many empty buildings there are. Not just empty office floors,
16:10 ↗but literally the whole building is empty. And this isn't new, but it's one thing to hear about on the news and see the stats, but it's another thing to like visually see a floor. And I there's one of my favorite hotels in downtown we always stay at. And so there's this one floor and this one building that's always empty. And we're talking like five years now. That means that owner of that office space of that building >> doesn't get any revenue. But that's not uncommon. It's almost anywhere in the city. I've only seen one building
16:43 ↗completely full from top to bottom. Can you guess who owns that building? >> Amazon. >> King County. >> Oh, >> it's a government building. >> Oh, no. >> It's a government building because they're usually the last to lay off. >> Yeah. >> So, when you say that King County is laying off people at the tune of 9,000 workers, >> well, this was the King County area, not the city of King County. >> But it doesn't matter. The point is as a whole, right? But I mean, think about that. How sad is it?
17:16 ↗>> I mean, I think that there shouldn't be layoffs in either places, but you would want it to kind of be equal. >> Yeah. >> But the government usually is the slowest to kind of lay people off. >> The government never trims the fat. Yeah. Especially here in Washington state. We know that. Our listeners, our subscribers know that Washington state is overspending at the state level, the local level, the county level, and that we are not practicing austerity and trimming the fat in any way possible, and it needs to be done.
17:48 ↗>> Isn't that crazy? In 5 years, >> yes, >> the only time I've seen an office building full from top to bottom was a government building. And that was I and you know I was like sitting there on the balcony looking at this building and in my mind I'm going huh I guess things are coming back for some people right >> and then I was like but wait and I did a Google search and I saw it was a King County building. I was like oh dang. >> Yeah >> that's crazy. Anyways just a of course
18:16 ↗anecdotal but what I'm saying is when King County starts laying off isn't that a big red flag? >> Absolutely. is Washington's unemployment, we've talked about this before, is at 4.9% in August. We are basically tied for the fifth highest unemployment in the state. And a really interesting stat, this one blew my mind. It's called long-term unemployed. Long-term unemployed has reached 28.3%, up from 19.8. Long-term unemployed, Benji, is when someone lost their job and be after they lost their job, they weren't able to get reemployed quickly. So, not only is the
19:06 ↗market are we losing some jobs, it's not just tech, but tech is one of the biggest sectors, it's also some of the most high-paying jobs, but then it's taking longer for that person to get rehired. So, as people look around and their friend got laid off and they have a friend who is taking them longer to get rehired in regards to the real estate market, they are pausing more and doing less. Layoffs are just part of this story. And I want to go into the five pipes or the five methods or these pillars
19:44 ↗on how because you started to give us one of them on how these layoffs then relate to home prices because it's not just layoffs. Pipe number one, nobody is moving to Washington state.
20:00–25:00 Read transcript
20:02 ↗Let me explain what I mean here. When you go look at census data specifically, we are losing taxpayers that pay higher taxes and the people that we are gaining are lowerpaying taxpayers and we're generally losing them to other states and most of the reason for our current population growth is immigration. But it's outside immigration coming into the United States. Well, the problem with that is what's happened with immigration in the Trump administration >> cut off completely. >> It's just freaking shut down. And then the uh the H1B visas. So that's held by
20:45 ↗a lot of tech workers. They're not being renewed at the same level. They're not being given out at the same level. Today I saw a post uh uh Microsoft's H1B visa got revoked. like they can't give them out. This is Microsoft >> and you know there's a lot of Yeah. >> H1B visa yes employees there just today it was announced. >> I I have not seen that article but it doesn't surprise me. >> There are two cities that really pop into my head right now. >> We were just looking at both and I was
21:20 ↗just looking at Samish. And in both of those areas, you're seeing larger price drops and what's called the percent of original list price. So in other words, if something was priced at it started at 100 grand and then it sold for 93,700, that's the percent of original list price, 93.7. And that's the exact number that's happening in Seamish right now. you're in September 2026, the average buyer got almost 7% off the price and that doesn't even include concessions and that's over a million bucks. Why? It's that move up buyer. Okay, that's pipe number four. That move
22:04 ↗up buyer is hitting pause. Pipe number one, nobody's moving here. We do because we make a lot of content. We have social media. We have a large web presence. We do a lot of SEO, AEO, GEO. We run a lot of ads. So, generally speaking, we have relocation clients coming in. And we have those relocation clients that hit us in fourth quarter who are planning for the next year. Ladies and gentlemen, I got whole this many relocation clients. What >> coming in right now? >> Zero. >> Zero. And usually >> I thought you were going to say like I
22:45 ↗got like 20 of them. >> No. >> Whoa. >> Usually we have anywhere between five to 10 during this time of the year that starts talking to us about they're coming in to our area for next year. I have zero. Also, and I've mentioned this before, so two of the listings will go on next week, but I have seven listings where every single one of these sellers is moving out of the state. And we've never had seven listings where the person is moving out of the state. And this is 500
23:19 ↗grand to 4 million. So, nobody's moving here. Two, people are not switching jobs as much. Okay, that's that long-term unemployed. When they're not switching jobs and having that shuffle, that shuffle causes home prices. Number three, RSU down payments are now not happening as much. >> What's RSU? >> RSU is your uh holy cow, I can't remember what the U stands for. It's the stock the company gives you that you hold on to until you've been there for a moment in time and then it vests. And then those people sell their stock or
23:58 ↗they take a line of credit against it in tech in order to go buy a home. When RSUs feel uh um uh shaky, people aren't moving that tech money around. And that's showing up. It's showing up in Belleview. It's showing up in Seamish. Not all of Bellev, but I think it was the 98004 if I remember correctly. I was looking at those numbers. I was like, "Oh my goodness, that area is starting to be down." So, people aren't moving here. We're not switching as much jobs. RSU, the move up buyer has hit pause.
24:35 ↗>> Sorry. Restricted stock unit. >> Restricted stock units. You have to be with the tech company for a period of time in order for them to vest. And it's a form of compensation to attract talent and to have people as a retention mechanism stay inside of the company. Inventory is building, but sellers aren't forced to sell.
25:00–30:00 Read transcript
25:00 ↗We don't have the forced sellers of the great financial crisis. And I'm going to get into that here in just a second. But this pipe, because sellers aren't forced to sell, decides whether the market is the slow grind, flat or down, or it becomes the crash. In the great financial crisis, sellers were forced to sell. >> They were forced to sell due to lack of equity, due to massive job loss, due to bankruptcy, death, divorce. Now, we still have things like that. So, that's, you know, and the foreclosure rate was
25:36 ↗massive. And we're going to get into comparison of the foreclosure rates here in a second. What we have next, though, or what we should be talking about is there's a type of property that's just getting crushed right now. And with all things, these is an opportunity. Even when things aren't perfect like this, it's an opportunity. We're going to get into the opportunities, but if you're thinking about what could these opportunities be, hit us up at rsg.com. Drop your questions or comments into the uh chat below, and we're happy to answer
26:13 ↗them and point you in the right direction based on the data. >> All right, so I think we should get into some stats on what's happening in the Seattle and King County area. Um, I see a whole bunch of numbers here. What is happening right now in the market? >> The market's having, you know, a freeze. And this freeze is a pause because demand is less. New listings in King County, September versus September, up 10.4%. Pending sales down almost 13. Closed sales down almost 17. Homes for sale up 28%. Months of supply
26:55 ↗up 36%. Median sales price month down 2.2%. That's 2.2% a crash. >> No. >> No. Come on. But it's still down. Okay. Percent of original list price down just slightly. What this means? Very simple. More homes are coming on the market. Buyers have more choices. Sellers must be priced correctly and not have wish pricing. Investors should be drooling and considering what they're going to go hunting for in fourth quarter. And the buyer should be saying when is the right time for me. And the sellers have to decide, do I want to sell or do I need to sell?
27:47 ↗This isn't a want to sell market. King County condos are doing even worse. Now, I'm talking about King County because it's our largest county. What do you think's happening with Snomish County and Pierce County and all the other ones? They're all just mirroring King County, very similar. Okay. If you want exact data about your neighborhood, your zip code, your home, hit us up at rsu.com or drop it right into the chat and we'll send you a link to that data. But we're happy to do this. When I look at condos, oh, pendings are down 23%,
28:21 ↗closed sales down 31%. Months, six and a half months of supply. That's that's not good. >> Strong buyers market. Strong buyers market. >> Yeah, you should define this because if you're a real estate agent, you know that when there's a lot of uh what do you call it? Inventory, right? That is a good thing for buyers because you have a lot of options. But talk about days on market and in this case months on market. >> So days on market is up just slightly. Days on market actually isn't that bad
28:56 ↗>> but the total supply. So generally speaking like if we go back to like right after COVID across the United States we're selling over 6 million homes. The market's on fire. Everything's being an over bid. That's when interest rates are super low >> and interest rates were like 3%. At that time we had between one to two months worth of inventory aka a hardcore sellers market and the sellers were getting everything and the buyers were complaining I have no control. Ladies and gentlemen, the buyer has control. It's buyer season. You're back baby.
29:33 ↗It's time to have some fun. when you hit about 4 months worth of inventory because we're used to the market moving so fast it starts shifting into the buyer market. So clearly King County, especially in condos, especially in certain product types, especially in certain cities or areas, is clearly a buyer market. Now, of course, if you want the one of one, ain't going to happen. If you want the waterfront home or the views galore, you know, that
30:00–35:00 Read transcript
30:00 ↗one's still going good. But you know, remember when we were talking about Patrick Bet David, make disrespectful offers. Is there a time when you should be making some disrespectful offers again? Yeah, it's Q4 of 2026. But we got to be smart about this. Here's what I see the novice do. They go to the brand new one day on the market and they're like, "Hey, will you take 10% off your price?" No one in their right freaking mind is going to take 10% off the price on day one. We got to go to the one
30:28 ↗that's been on the market a few months. We got to go off the market. Okay, we got to go hunting where other people aren't hunting in order to find those deals. And you guys know how to hit us up if you want to find those deals. Let's look at Belleview and Kirkland east side. So that's Belle, Redmond, Kirkland. The median 1.6 in in price, median sales price down about 3.1. Belleview, west of I405, very expensive, almost 3.5 million, down 14.7%. That is a large double-digit drop. >> Are you would you call that almost
31:06 ↗crashing in a way home price >> that that is a crash, but you can't really call a crash when it's on the luxury end because the luxury buyer and seller can absorb it. It doesn't become systemic like the great financial crisis because this is just the top end losing a little bit of money. The problem is when the median and below starts to fall apart, that's when you run into the great financial crisis. >> Can I ask a question? >> Yes, hit me. >> All right. So, tell me what is going on
31:36 ↗with Seattle because we skipped that right there. Okay. And you said you promise what type of property is getting crushed in Seattle. >> Oh, yeah. >> So, tell me what's happening in the Seattle area in terms of the market as well as, you know, what properties we should be looking out for. So, if we just zoom into Seattle, 3,658, homes for sale up 16%. Pendings's down 13%. Median sales price down about 1.2. Showings per listing, aka the number of people looking down about 22%. Here's what I'm seeing personally. I'm seeing
32:13 ↗agents actively disengage. I talked to Arman in the office. I bumped into him in the lobby and him and I were having a discussion. And one of the things I love to say to other agents is like, "What are you buying right now? What are you doing? What listing did you take this week?" It's it's that's my method of encouragement. And so I asked him how his business was. He goes, "Man, I'm working really hard, but it's good." And I said, "Well, what are you what are you seeing?" He goes,
32:38 ↗and he he literally did that. He dropped his paper. He dropped his pen. He looks at me and he goes, "I cannot find other agents." I go, "What do you mean?" He goes, "My showings on my listings, I can't get people to call me back. The buyer agents, the listings I call on, I can't get the listing agents to call them back." He goes, "It's fourth quarter and they're actively disengaged." And I've been telling this to my team. I've been telling this to the people who have asked me for guidance. Fourth quarter of 2026,
33:07 ↗we personally are going to make it rain just like we did in 2023. 2023 was the best fourth quarter I have had in the last eight years because everyone was actively disengaged. I feel the brokers are actively disengaged again. And so what are we going to do? We're actually just going to work a little bit more and have a little more fun and have fun with our buyers, our sellers, our investors and just slay it because you're seeing this active disengagement. And you asked the perfect question leading up to one
33:36 ↗of the promises that we have to deliver on. Ladies and gentlemen, what product type do you think is getting decimated here in the Seattle metro? Not just Seattle, I'm talking the whole metroun. New construction. New construction is getting hit absolutely the worst. Seattle new construction pendings are down 38%. Well, inventory is up 46%. I grabbed the specific new construction data out of the NWMLS for King and Snowomish just so I would have this. King County new construction listings total up 8.4. Snowomish County down slightly. Homes for sale though, this is
34:15 ↗where it just blows my mind. 21% more homes for sale in King County year to date and 27% more in Snowomish County. One of the builders and developers I talked to yesterday told me, "I am not putting in any more permits because my product's not selling." I was called this week. See, I get called to solve problems. I'm the real estate solutions group. So, I got called by a gentleman who owns a a a plat. There are multiple homes available in this plat. Two of them have sold and the rest are unsold. And he said, "What
34:56 ↗do I do?" I said, "You do." I was like I
35:00–40:00 Read transcript
35:00 ↗was like I was like, "I'm going to tell you what you want to what you have to do, but it may not be what you want to hear, and I'm going to tell you the truth." He goes, "That's why I I called you. I was told by another friend, you'll just be blunt." And I was like, "Yes, sir. I'll tell you exactly where you're at and what you need to do. Let me go do the research." I open it up for two seconds. I go, "Oh, man. month supply 4.9 in King County and uh
35:32 ↗four in Snowomish County but the median sales price in new construction down 6.6 Snomish County double digit down 11%. Now, this is just single family. This does not include town home. This does not include condos. Town homes and condos are worse. So, if someone says, "I want to get the best deal possible." I will tell you some of the best deal possible right now is in new construction because of the incentives that they are providing, the buy down of the interest rates, the goodies they are providing, the home warranties they are providing because
36:10 ↗they're sitting on this inventory. Also, mark my words. I've said this a couple times that we're somewhere near peak fear right now. I feel it. This feels similar to where we were in the great financial crisis. Could I be wrong? Absolutely. Could this go on for another year? Absolutely. But we're somewhere near the the peak fear and the potential bottom is my my thought. And the reason I bring that up specifically is these builders are not submitting permits. And because they are not submitting permits and they are not submitting development applications,
36:53 ↗even if population stays flat, but population is slightly growing in Washington state, but if population even stayed flat, that lack of permits will force prices up in the future due to the lack of inventory. Period. in a discussion. We lose homes to fire, to falling trees, to floods, to anything that you can think of. There's always a percentage of the housing stock that you're losing. Housing stock has to be replaced. We are behind on housing and now permits are massively down. That will cause us to turn the corner. Question, brother man.
37:30 ↗>> Well, then the four sellers, would that be the builders and the developers? >> That's a very good point. The four sellers, the closest we can get to it is the builders and the developers. Why? They don't have one mortgage. They have 20, 30, 100 mortgages. However, you're not seeing them reduce their price as much as you would expect because when you have 10 or 20 homes, you can't just reduce it. You've got to do creative financing. That's why they're giving away the super low interest rates. But still a great question like who is the
38:05 ↗force seller? Where is the force seller going to come from? And there was a headline that just popped up recently. It said, "Washington state foreclosures are up 41%. Lions and tigers and bears. Oh my, it's the great financial crisis." So I go through and read the comments and everyone's like, "It's 2008 times two. We're going to the gold standard. Nobody wants the dollar." Yeah. And so they're they're the doomerism believes that everything is just going to break. So let's go through real numbers. 2,482 Washington properties got a foreclosure filing in the first half of 2026.
38:46 ↗That is one in every 1,332 homes. About 8% of Washington. And Washington ranks 40th out of 50 states for foreclosures. So, we're up 41%. Don't let the data scare you. So, this is why we talk about this. Go look, figure out the next few layers of the data. Figure out how it ties together and then just call us. Have us explain it. When you see these comments, you see these headlines. Let us know how does it relate to the great financial crisis. In the great financial crisis nationally, we hit uh 2.23%
39:30 ↗in 2012. In other words, one in 45 homes was in foreclosure. Today, it's 16 nationally. One in every 632. Okay. Uh sorry, that's got to what is that? 12x 15x where it is for us to catch up with the GFC. US properties with a foreclosure filing 2 million 870,000 in 2010.
40:00–45:00 Read transcript
40:02 ↗Nationally 227,548 from January to June of this year, the first six months of this year. Washington State 1 in 432 homes in a single month. uh or excuse me 1 in 413 during the great financial crisis. Today it's 1 in 1,332. In the great financial crisis we were the 14th worst worst state. Today we are the 40th. So in one month in 2010, Washington put Washington put three times as many foreclosures as its share of homes and it did the entire of this year in one month. This does not compare in any way to the great
40:54 ↗financial crisis. Why did that happen? Why it's different? We were driven by the risky loans, the ninja loans, the no income, the the the liar loans. You didn't have to have good credit. We were joking the other day in a in a sales meeting. Someone said, "Hey, what was it like in the early 2000s?" I was like, "Did you file bankruptcy?" And the person's like, "Yeah." I was like, "We got you a house." I was like, "Just got a divorce. We got you a house." In the middle of getting into a divorce, got
41:26 ↗you a house. No job. Get you a house. in the middle of the financial crisis. So this is >> No, no, no. This is right before the financial crisis. Got it. This was the shenanigans that led to the final >> 2007. >> This is So I got in in 2003. My understanding this started basically like 2000 to 200, you know, six and seven is where these shenanigans happen. But they were just shenanigans. No one right out of bankruptcy should have been able to buy a home. No one should have been able to get a negative amortization
41:58 ↗loan. That means you make a lower payment and the principal balance grows. What? That's who can't do math? Who Who would have thought that's going to be a an okay thing in the future? Another way to look at this, about half of US mortgages carry a rate below four. Nearly 80% are below 6%. on uh I didn't throw it in here though uh but the stat was something like this something like during the great financial crisis the average loan to value was like 82%. And now the average loan to value is in
42:41 ↗the 40s. So the force seller happened because there was no equity because everyone used their home like an ATM. So when prices dropped a little bit, all of a sudden people were underwater when they had to sell, most homes would have to drop in half and the seller could still break even selling it with average sales cost. It's pretty wild. We know that there's some crazy headlines. Obviously, there's some more foreclosures, but not nearly like 2008. We know that tech jobs are leaving, but the question is this. How many people
43:18 ↗have to get laid off? And how many jobs do we have to lose before home prices actually go down considering that we just have lack of inventory as well? Which is like there's just not enough homes for the people that exist in this state and in this country. >> Yeah. How many tech jobs would we have to lose for prices to fall? There's an honest answer here. There's no magic count. Economists have measured this multiple ways and it kind of goes into that peak fear idea that we were talking about. The local job shock
43:55 ↗does cause home prices to change, but it's smaller than what people think because the doomer narrative goes on much deeper because it's so emotional and visceral. Local job shocks. There was a study by Blanchard and Cans found that negative local employment shocks bring home prices down a whopping 2% at the bottom. So in other words, if they're being pulled down because of something else, it'll bring it down about another 2%. And it takes about four to five years to arrive at that bottom. Ladies and gentlemen, when did we peak in home
44:30 ↗prices here in the Seattle metro? It was 2022. And since then prices have basically been flat, slightly down, slightly up. But that was our peak and then we pulled back. Why? Because of that massive rise in interest rates. And I just told you these researchers say it takes about four to five years to find the bottom. 22 + 5 is 2027. Oh, when did we find the the bottom the last time? We peaked in 2007. Add five
45:00–50:00 Read transcript
45:01 ↗years to it. Oh, guess when the bottom was 2012. So, is history repeating itself? It feels like it to me. Time will tell and the data will tell and we'll keep you informed. That's why you subscribe. Okay. Tech Wealth. San Francisco Fed. I thought this one was very interesting. found a 10% move in local stocks caused home prices to move up one to two percent over the next two years. So in other words, as tech workers stock compensation, those RSUs or their stock portfolio grows, that causes home prices to rise because people feel rich. They
45:45 ↗feel like they have more money and they of course they can borrow against it for their down payment. There was another study, and I'm not even going to try to pronounce this person's last name, that prices fall harder after bad shocks than they rise after good ones. And so you look at this and you go, wait a second, this is singledigits falling over a, you know, years. And that's what layoffs do alone. So well, what happened here in Seattle? What happened to us? We had the double whammy. See, the Federal Reserve
46:24 ↗massively hiked rates in 2022. So, you had rates go from three to almost eight. Then you did have those tech layoffs. So, it's pulling us down a little bit worse. What? And I'm going to do a live about this one. According to the Red Fin Data Center, we just snuck into number one as the bottom metro in the United States for trending in a downward direction. When I did the live on Tuesday, we were number two and San Antonio was number one. And I was just going to show it to
47:05 ↗someone. I pulled it up yesterday afternoon because the data had been updated. I was like, "Oh, never mind. We're no longer in second place. We just beat San Antonio because we're receiving the double whammy of the layoffs, of the rate shocks, but it's a slow grind and the headlines make this seem like it's a bigger issue. So really what's happening is you've got a lot of FUD, fear, uncertainty, and doubt that's sitting in the market that's causing people to be paralyzed and wait. And yet we have people getting great deals of two young gentlemen who
47:42 ↗sell real estate. One of them has been selling real estate for years. He bought a his first home this year. He's been selling real estate for 5 years. Why would he buy his first home if he thought the market was going to collapse? He doesn't. He believes that the market like this is going to be one of those peak times to buy where he can get the best opportunity. and he bought, you know, it needs a little elbow grease, needs a little love. So, he's going to create some equity fixing that
48:12 ↗property uh that property up. We talked about rates peaking. And in that rate peaking, there's a couple things I want to point out to you because it really fundamentally changed the math. If the King County median sales price is 950 with 20% down, you get a $760,000 loan. Rates dramatically shot up. I mean rates literally are basically seven and a half right now and one year ago they were 6.34. So that's how much it's pinching us. So a year ago for that 760,000 principal and interest was going to cost you about
48:49 ↗$4,700 a month. Two weeks ago before rates shot up again we were at 7% that was just over 5,000 5,72. Today at 7.49 49. That's $5,39 a month. That's almost $500 more than just a year ago. And in one week, that 25 basis point jump or the 0.25 alone cost the average buyer about $128 a month. So housing didn't get fundamentally more expensive. The rates did. The purchasing power got massively expensive. So, it started hurting both sides. As I was reading and finally preparing for this, I saw that realtor.com was talking about the best time to buy.
49:44 ↗I thought this was a really super interesting article. And so, my actually my first thought was like that's BS because realtor.com basically said nationally September 27th to October 3rd is the best time to buy. And what do you think they said here about the Seattle
50:00–55:00 Read transcript
50:00 ↗Metro? >> Probably the best time to buy. >> The best time to buy is literally coming in the next two weeks. >> Yeah. So they said that it is October 18th through the 24th. >> But what about rates? >> They rates were not the factor in this one. So when they went in, they rated or weighted, excuse me, their factors. They talked about the amount of inventory on the market, the amount of seller concessions people were getting, the price reductions that they were getting, and they believe this kind of beginning
50:34 ↗of fourth quarter is the most optimal time because there's still a lot of inventory, and yet people are getting good prices off. Now, of course, the further we go into the winter, the more price reductions and price off people get, but there's less inventory because people cancel it. My first initial reaction was BS. So I literally ripped open the article, dropped it into chat GPT, turned Astra on YOLO mode, and I said, "Rip all the data out. Tell me all the data that you need out of the MLS, and I'll feed it back into you. Let's
51:10 ↗confirm this." Burned a bajillion tokens. And Astro goes, I 100% agree with their findings based on the data. I was like, "What?" So, I reconfirmed their findings, not based on rates, but based on the other factors inside the market, the Seattle metro, starting here in just a little bit, is one of the best times to buy. Now, I will tell you, our investors, our first-time home buyers are people that have to do things for business and for tax reasons. Fourth quarter is always the best for them. So, I want to leave you with just
51:47 ↗a couple quick playbooks with a couple ideas on what you should be doing here in relation to real estate. I'm going to start with the business owner. The business owner who has a tax problem and they can use real estate to reduce their tax burden. That's something that we should be looking at for the end of the year. And generally speaking, for those people, we're buying commercial real estate. We're buying gas stations, multif family. We're buying them office buildings, warehouses, things like that that they're going to use inside of their business. Phenomenal tax strategy.
52:21 ↗We can talk about that more. I'm not a tax guy. I just spend a lot of money on taxes and tax attorneys, so I know what we're doing. We get involved with them. For our first-time home buyers, this winter season will be that time that you can get that rate buy down that you need to qualify, that you can ask for the closing cost, that you can get the timelines for it to happen, that you can uh we had a buyer recently break their lease. the seller paid to break the buyer's
53:02 ↗lease of the home they bought. They just wrote it into the contract. You can ask for anything. Now, it doesn't mean you're going to get it. And that seller of course had to be motivated. Also, if you're thinking, "Hey, my goal is to do this in 2027." I would start looking today for my move up buyer or my buyer that's moving to another area. We actually have to analyze the data with you to decide if now is the right time because spring might be better. It's going to depend on the home that we're selling and the
53:36 ↗target property and area that we are acquiring and where the data sits to where that that balance is. For some of our people completely do it now. It's great. For some of the people it's going to be spring. For some of the people it's going to be you need to wait. There's a lot of data that we got to uh put into that with all of these people. Oh, hold on. We got to talk about the investors with our investors. Our investors should be shopping. I spoke with another investor yesterday. Uh
54:00 ↗they're building some daddos and he had me look at a development project in Stanwood. Stanwood is very overs supplied right now. Uh kind of scary if you're going to go fight in uh Stanwood, Washington. And I said, "Well, here's here's my thoughts on why this is not selling and you know what you need to do." And then he goes, "Hey, you got any permits?" And I was like, "Brother, man, I always got permits." I was like, "I got permits. I got projects. I have things I can always sell you." He goes, "You got a single
54:32 ↗family or a dad that you guys would let go of right now?" And I go, "Yeah, what do you uh we got a nice little 1500 square foot uh single family in uh Lake Stevens." He goes, "Send it over." He goes, "Anything else?" I goes, "Yeah, we got this other one and then I've got this other listing coming." and he said, "Well, let me know when that listing, you know, goes on the market cuz it's going to go on the market in like a week." But the moral of the story
54:58 ↗is they're out shopping right now to
55:00–58:11 Read transcript
55:00 ↗fill their pipeline for 2027. You need to follow the inventory. You need to follow the motivated seller. You need to look for higher days on market. It's not just about the price. It's about the payment. It's about getting those buy downs. It's about getting those protections. It's also about, you know, kind of a creative idea of looking for creative financing options where maybe you can assume a mortgage, maybe you can wrap the underlying mortgage. That's a whole creative financing strategy in itself. And for the sellers that are on the market or considering
55:35 ↗going on the market, you got to look at the data. If the market is trending in a slight downward direction, please understand it's like you're a little kid and you just dropped your basketball and your basketball is now rolling away from you down the hill. In order to go get your basketball, you have to run in front of it and get ahead of it. Get ahead of the market. When I talked um uh uh last week at a um at a event with a bunch of people, I said you need to
56:10 ↗take those comparables and the comparables based on their age, you have to wait adjust them. In other words, if it's a few months old, you have to look at the rate at which the market is changing and you have to pull that off that comparable and probably slightly a little bit more in order to get in front of that ball. And a bunch of agents came up and they're like, "Oh, I hadn't thought of that." It's because they didn't go through the great financial crisis. They haven't seen this playbook before. Three
56:40 ↗things to remember as we close here. It's not the people who got fired. It's the ones who are getting nervous. And I love Warren Buffett's quote, you should be greedy when others are fearful and fearful when others are greedy. And so I just told you new construction was getting decimated. And what did Warren Buffett just invest in in the last few weeks? He went and put money into a new construction home builder because the new construction home builder is slightly beat up. I'm telling you what I am also doing. Layoffs alone just give
57:18 ↗you the slight grind down. But it's the layoffs. It's the rate shocks. It's the Iran conflict. It's all of this uncertainty. And of course, now elections right around the corner, too. Midterms. Markets do not reward people who wait for the perfect time. They reward people who choose their goals and take action towards them. You can hit us up at rsg.com if we can help you at all in real estate. And please, the majority of the audience who watches these is not subscribed. So, if you guys would subscribe, comment, share this with an
57:53 ↗agent that needs to see this data. Share this with a friend that needs to see this. And remember, according to realtor.com and Chad GPT, verified their data, the buying window starts right around the corner here, October 18th. Let's go, people. Thank you.
14 / Frequently asked questions
Seattle tech layoffs and home prices: your questions.
How many tech layoffs would cause Seattle home prices to crash?
There is no established headcount threshold. The effect depends on local job losses relative to employment, rehiring, household reserves, mortgage costs, available inventory and forced selling. Announced company-wide cuts cannot be treated as Seattle job losses. The supplied September King County residential data show fewer transactions and a 2.2% year-over-year median price decline, not proof of a crash.
Is the Seattle housing market crashing or freezing?
The September 2026 snapshot is more consistent with a slowdown: King County residential pending sales fell 12.9%, closings fell 17.6%, inventory rose 28.1% and the median fell 2.2% year over year. Condos and new construction face greater pressure. These are different property segments, and a transaction median is not the change in value of every home.
Is fourth quarter a good time to buy a Seattle-area home?
For a prepared buyer, fourth quarter can be a useful time to negotiate price, seller credits, inspections and financing terms. Realtor.com identifies October 18–24 as Seattle’s historical seasonal window, but its score excludes mortgage rates. Our monthly public-data reconstruction ranks October first at 69.0 and September second at 68.4, supporting a broader fall window rather than independently verifying one exact week. Buy when the full payment, reserves, income stability and holding period work for you; a calendar date does not guarantee savings.
Does Realtor.com predict a 7.5% discount on my house?
No. The 7.5% figure compares historical Seattle-Tacoma-Bellevue median listing prices in the selected week with their seasonal peak. It is not a forecast, a closed-sale discount, a same-home value change or a guaranteed negotiation result. Its +31.9% inventory comparison is against an average week, and its −52.4% views comparison is against peak views.
Why are new construction and condos worth comparing?
The supplied September new construction data show 5.9 months of pending-based supply in King County and 4.8 in Snohomish County. King County condos have 6.5 months of supply. Carrying costs can motivate sellers, but incentives and conditions depend on the property. Review builder loan terms, warranties, HOA finances, assessments and comparable resale options.
Is a 2-1 buydown better than a price cut?
It can provide more early monthly payment relief, but it is not universally better. A price cut reduces the purchase price permanently. A 2-1 buydown subsidizes payments for two years; the borrower must be able to afford the full payment afterward. The lender must confirm program eligibility, contribution caps, qualification and actual costs. Refinancing is not guaranteed.
Can an investor assume any homeowner’s low-rate mortgage?
No. FHA, VA and some USDA loans may allow approved assumptions subject to their rules, buyer eligibility and lender or agency approval. Many are intended for owner occupancy. Most conventional mortgages contain due-on-sale provisions. An equity gap, seller release of liability and VA entitlement also need review. A low rate alone does not make a loan transferable or suitable for an investment property.
What should sellers do when buyer demand slows?
Use current competing listings and recent comparable sales, prepare the property before launch and compare a price adjustment with lender-approved credits. Review showing activity and offers early. Historical spring pricing and a countywide median are not substitutes for a property-specific pricing plan.
How should a business owner approach this market?
Separate the down payment from operating reserves, payroll, tax obligations and working capital. Stress-test both business cash flow and household income, especially when customers or compensation depend on tech. Compare owning, leasing and postponing based on the property’s use, financing and holding costs with your lender, CPA and attorney.
Are foreclosure filings the same as completed foreclosures?
No. ATTOM includes default notices, scheduled auctions and bank repossessions. Washington’s first-half 2026 count was 2,482 properties, about 0.08% of housing units. A rise from a small base is different from widespread forced selling. The historical Washington comparison uses one month of 2010 against six months of 2026, so the periods are not directly equivalent.
Are the new construction year-to-date price figures true YTD medians?
No. In the supplied export analysis, new listings are summed, inventory and months of supply are monthly averages, and the price summary is an average of nine monthly medians. It cannot establish the price change of the same homes. The September comparisons are separate monthly medians; sale mix can move them materially.
Where are the episode video and transcript?
Watch the October 9 episode in the video player under The discussion behind this guide. The complete available YouTube auto-generated captions are directly below it, grouped into expandable time ranges with paragraph timestamps and an original TXT download. Captions may contain errors; use the sourced article for figures and limitations. The episode outline is a separate editorial input.
15 / Read the numbers correctly
Source dates, definitions and open checks.
- Editorial inputs. This guide is based on Anton’s October 8, 2026 notes, research and episode outline. The October 9 update adds the October 8 Realtor.com public-data verification packet. The October 9 episode and its complete available YouTube auto-generated captions are now included. The outline remains a separate editorial input; captions retain the spoken discussion and may contain transcription errors.
- Primary housing inputs. September King County residential and condo figures and King/Snohomish new construction are reproduced from the supplied NWMLS / InfoSparks research tables. Original PDF/export files have not been independently reconciled for this guide.
- Geography and types. Seattle city, Seattle-Tacoma-Bellevue metro, King County, the Eastside and Washington are different places. Residential, condos, resale and new construction are different filters. August, September, Q2 and rolling periods are not combined into one trend.
- Medians and supply. Medians reflect transaction mix, not every home’s value. New construction YTD summaries use monthly averages as labeled; pending-based months of supply is retained. Inventory cannot be summed like new listings.
- Employment and causation. WARN announcements, net city employment and company-wide cuts are distinct. The research does not identify which sellers lost jobs. Relocation, RSU down payments and move-up hesitation are hypotheses, not measured causal effects.
- Payment method. Monthly P&I equals loan × monthly rate ÷ [1 − (1 + monthly rate) to the power −360]. Figures are recomputed from unrounded values and displayed to the nearest dollar. Actual loan pricing, fees and ownership costs vary.
- Historical comparisons. Case-Shiller uses a different method from NWMLS medians. Historical foreclosure windows differ. None is an equation predicting a 2026 crash.
Items that still need a source refresh or specialist confirmation
- Latest PMMS after the October 1 benchmark; latest full-month Redfin metro ranking.
- Licensed lender review of the subsidy illustration and any actual financing proposal.
- Xbox’s conflicting Washington count: 268 versus about 300.
- Original DSA report and the historical Washington foreclosure archive.
- September Bellevue/Kirkland data; September county Recaps; Pierce/Kitsap new construction and county pending counts; true InfoSparks YTD medians.
- Single-source Seattle showing activity; aggregator statewide WARN totals; secondhand Bellevue/Zillow estimates and affordability figures. These are not promoted into the headline cards.
- The Google notes and episode package disagree on West Bellevue’s June median/change. That figure is withheld pending reconciliation.
- Claims about application lows and ARM historical highs remain unconfirmed and are not used as facts.
For educational and entertainment purposes only. Not legal, financial, tax, or real estate advice. Consult qualified professionals and verify information for your own situation. Figures are a dated snapshot and may be revised.
16 / Follow the evidence
All research sources and links.
These are the sources supplied with the research package, plus primary financing guidance used to clarify the playbooks. Listing a link does not certify every claim on that page. Some links are rolling reports, paywalled, unavailable to automated access or secondary summaries; dates and limitations above control this guide’s use of them.
Owner-supplied NWMLS data
King County Local Market Update, September 2026 (current as of October 1); InfoSparks new construction residential exports for King and Snohomish, pulled October 8. The package did not include public links to those originals. NWMLS publisher. The tables in this guide preserve the supplied attribution and filters.
Labor market and layoffs · 31 links
- Challenger — September 2026 job cuts and hiring plans ↗
- Challenger — August 2026 report (PDF) ↗
- Challenger — July 2026 report ↗
- HR Dive — H1 tech layoffs ↗
- CPA Practice Advisor — September job cuts ↗
- KORE1 — Q4 tech job market forecast ↗
- KUOW — Seattle city employment / DSA ↗
- KUOW — Washington tech layoffs / Revelio ↗
- Axios — September Seattle tech employment ↗
- Axios — January Seattle tech layoffs ↗
- Axios — February Washington layoffs ↗
- RetrainMap — Amazon Washington WARN ↗
- FOX 13 — Amazon 121 Washington layoffs ↗
- FOX 13 — Microsoft 605 Washington employees ↗
- KOMO — Microsoft / Xbox Washington cuts ↗
- OPB — Xbox Washington layoffs ↗
- WARN Act — Microsoft filings ↗
- WARN Firehose — Redmond filings ↗
- WARN Firehose — Seattle metro ↗
- Layoff Data — Washington 2026 ↗
- China Daily / Xinhua — Amazon cuts and capital spending ↗
- eMarketer — Amazon and tech restructuring ↗
- KMXT / NPR — Amazon layoffs and AI spending ↗
- Pakistan Today / Reuters — Amazon cuts ↗
- Invezz — Amazon Prime event cuts ↗
- Washington ESD — Facts and Figures ↗
- Washington ESD ↗
- BLS — State employment and unemployment ↗
- FRED — Washington unemployment (WAUR) ↗
- Joint Economic Committee — Washington employment ↗
- Trading Economics — Challenger forecast ↗
Housing market · 19 links
- The Madrona Group — Seattle market report ↗
- NWMLS — August 2026 Market Snapshot ↗
- NWMLS — August 2026 Recaps (PDF) ↗
- Seattle King County REALTORS — August NWMLS report ↗
- Windermere W Report — September update ↗
- Windermere Bellevue — January update ↗
- Windermere Bellevue — February update ↗
- Windermere Bellevue — March update ↗
- Beyond Real Estate — October 7 update ↗
- Beyond Real Estate — county comparison ↗
- Connecting You Home — September Seattle update ↗
- Resideline — Bellevue market ↗
- RexMont — Bellevue market ↗
- Seattle Red — sellers outnumber buyers ↗
- Redfin — July pending-sales declines ↗
- Redfin / Business Wire — February pendings ↗
- KOMO — Seattle pending sales and tech shifts ↗
- Axios — Case-Shiller and inventory ↗
- Sammamish Mortgage — secondary Zillow context ↗
Foreclosures and mortgage lock-in · 13 links
- ATTOM — Mid-Year 2026 Foreclosure Market Report ↗
- HousingWire — ATTOM midyear report ↗
- The Title Report — Q1 foreclosure activity ↗
- Safeguard Properties — August foreclosure activity ↗
- HousingWire — 2010 record filings ↗
- AOL — 2010 foreclosure filings ↗
- Seattle Bubble — August 2010 foreclosures ↗
- Seattle Bubble — October 2010 foreclosures ↗
- KNKX — January 2011 foreclosures ↗
- ABC / Sinclair — foreclosure drivers ↗
- HomeLight — mortgage lock-in ↗
- Wolf Street — FHFA Q2 mortgage rates ↗
- The Money Overview — Barr / mortgage rates ↗
Research and historical precedent · 17 links
- San Francisco Fed — Tech Stocks and House Prices in California ↗
- Hartman-Glaser et al. — IPO wealth and housing ↗
- Journal of Real Estate Research — IPOs and housing ↗
- Chodorow-Reich, Nenov and Simsek — stock wealth / SSRN ↗
- arXiv 2601.00914 — local shocks research (PDF) ↗
- Blanchard and Katz — Regional Evolutions, original paper (PDF) ↗
- Notowidigdo — NBER Working Paper 17167 (PDF) ↗
- NBER Working Paper 33576 — supply constraints counterpoint (PDF) ↗
- Seattle Economic Update — December 2004 (PDF) ↗
- Zillow Research — Bay Area dot-com bust ↗
- BLS — Silicon Valley employment and wages (PDF) ↗
- S&P Dow Jones Indices — July 2023 release (PDF) ↗
- YCharts — Seattle Case-Shiller ↗
- Washington Research Council — Seattle Case-Shiller ↗
- Seattle Bubble — Case-Shiller 2012 ↗
- SocketSite — San Francisco Case-Shiller ↗
- Seattle Times — tech jobs and correction ↗
Mortgage rates and forecasts · 21 links
- Freddie Mac — Primary Mortgage Market Survey ↗
- Freddie Mac — October 1, 2026, 7.28% release ↗
- FRED — 30-year mortgage rate ↗
- Fox Business — October 1 mortgage rates ↗
- The Real Deal — rates near three-year high ↗
- WRE News — October 2026 mortgage rates ↗
- MBA — October 7 Weekly Applications Survey ↗
- MBA Newslink — October 1 survey ↗
- The Money Overview — MBA 7.49% rate ↗
- Trading Economics — mortgage applications ↗
- Bloomberg / Yahoo — Treasury yield ↗
- Quartz — Treasury yield ↗
- NBC News — Treasury yields ↗
- CNBC — October 8 Treasuries ↗
- Forbes — 10-year Treasury yield ↗
- Bloomingbit — Treasury 5.36% ↗
- SBS — diverging Wall Street forecasts ↗
- Capital Economics — October housing chart pack ↗
- Capital Economics — earlier outlook ↗
- Axios — October 1 mortgage rates ↗
- Yahoo / ResiClub — earlier 2026 forecast roundup ↗
Realtor.com Best Time to Buy · 8 links
- Realtor.com Economic Research — 2026 report and Seattle Metro table ↗
- Realtor.com — 2026 best-week article ↗
- Realtor.com / PR Newswire — full release and metro table ↗
- Trivano — release copy with metro table ↗
- RealtyTimes — best week report ↗
- Inc. — 2026 best week ↗
- The MortgagePoint — best time to buy ↗
- Seattle Red — Seattle best week ↗
Financing rules used to clarify the playbooks · 6 links
Seattle Metro seasonal verification and public data · 10 links
- Realtor.com Economic Research — data and definitions ↗
- Realtor.com — metro core listing history (CSV) ↗
- Realtor.com — metro hotness history (CSV) ↗
- Redfin — data downloads used in the packet's cross-check ↗
- Redfin — regional rolling-window history (CSV) ↗
- Redfin — methodology ↗
- NWMLS — October 6 regional inventory release cited in the packet ↗
- AskAnton — October 8 monthly score data (CSV) ↗
- AskAnton — seasonal method, limitations and source links ↗
- AskAnton — October 8 reproducible seasonal research packet (ZIP) ↗
Episode video and actual captions · 2 links
References whose exact article URL was not captured
- Mortgage Professional America — Redfin four-week Seattle pending-sales comparison ending September 13. Exact article link not supplied.
- MyNorthwest — June 2026 NWMLS Eastside data. Exact article link not supplied.
- Windermere — Mercer Island Q2 2026 report. Exact report link not supplied.
- GeekWire Meta corroboration, the Redfin August 12 agent quote, the Boeing historical account and the original DSA PDF were named without exact links. They remain references to locate, not invented citations.