The direct answer
Seattle’s housing slowdown is real, and the selected tech corridor shows deeper year-to-date declines than the comparison ZIPs. More listings, weaker pending demand and longer selling times make the employment connection plausible. The data do not prove that layoffs caused a specific price decline, and they do not show uniform acceleration across the corridor. For a buyer or seller, the useful question is what is happening in the competing homes around the property.
01 / What changed
A weaker demand engine meets more homes for sale.
For years, technology employment helped replenish Seattle-area housing demand: a new hire moving to the region, a promotion funding a larger home, or stock compensation increasing a down payment. When that flow slows, the effect can reach housing even before an owner needs to sell. A household can postpone a purchase, stay in its existing home or lower its budget.
That is the argument behind the video’s title. “Starting to break” describes pressure on the market’s old assumptions about buyer depth and pricing power. It is an interpretation of the evidence, not a finding that every Seattle-area home is falling at the same rate.
What the NWMLS data supports
- Meaningful residential price declines in several Eastside and north-suburban ZIPs.
- More new listings alongside weaker pending-sales growth in the selected tech groups.
- Longer marketing times and substantial differences between nearby markets.
What remains unproven
- How much of any decline was caused by layoffs.
- A uniform, accelerating downturn across the whole corridor.
- That a seller is distressed, or that a buyer can demand the same discount as the ZIP’s median decline.
The housing evidence below prioritizes 108 supplied NWMLS FastStats reports. Redfin, Zillow and employment reporting provide separate context with their own dates and definitions.
02 / Watch the discussion
The full Seattle housing market breakdown.
Watch the September 29 livestream, then use the tables below to separate specific ZIP results from city proxies and county totals.
Press Play to watch · 61 minutes · Watch on YouTube ↗
The YouTube player loads automatically without autoplay. Your browser may connect to YouTube before you press Play. Google’s Privacy Policy applies.
A clarification for viewers: the video description’s Bellevue −13.2%, Bothell −13.0% and Redmond −4.3% figures refer to residential ZIPs 98007, 98021 and 98052. Broader postal-market proxies give different numbers. Read the full transcript.
03 / Compare the places
Where the correction is deepest.
Bothell and Kirkland stand out among the requested postal markets, with residential year-to-date proxies down about 9.3% and 9.2%. Bellevue’s proxy is down about 6.0%; Redmond’s is down about 3.3%. These are weighted averages of the medians in each market’s selected ZIPs. They are useful comparison tools, but they are not official municipal medians.
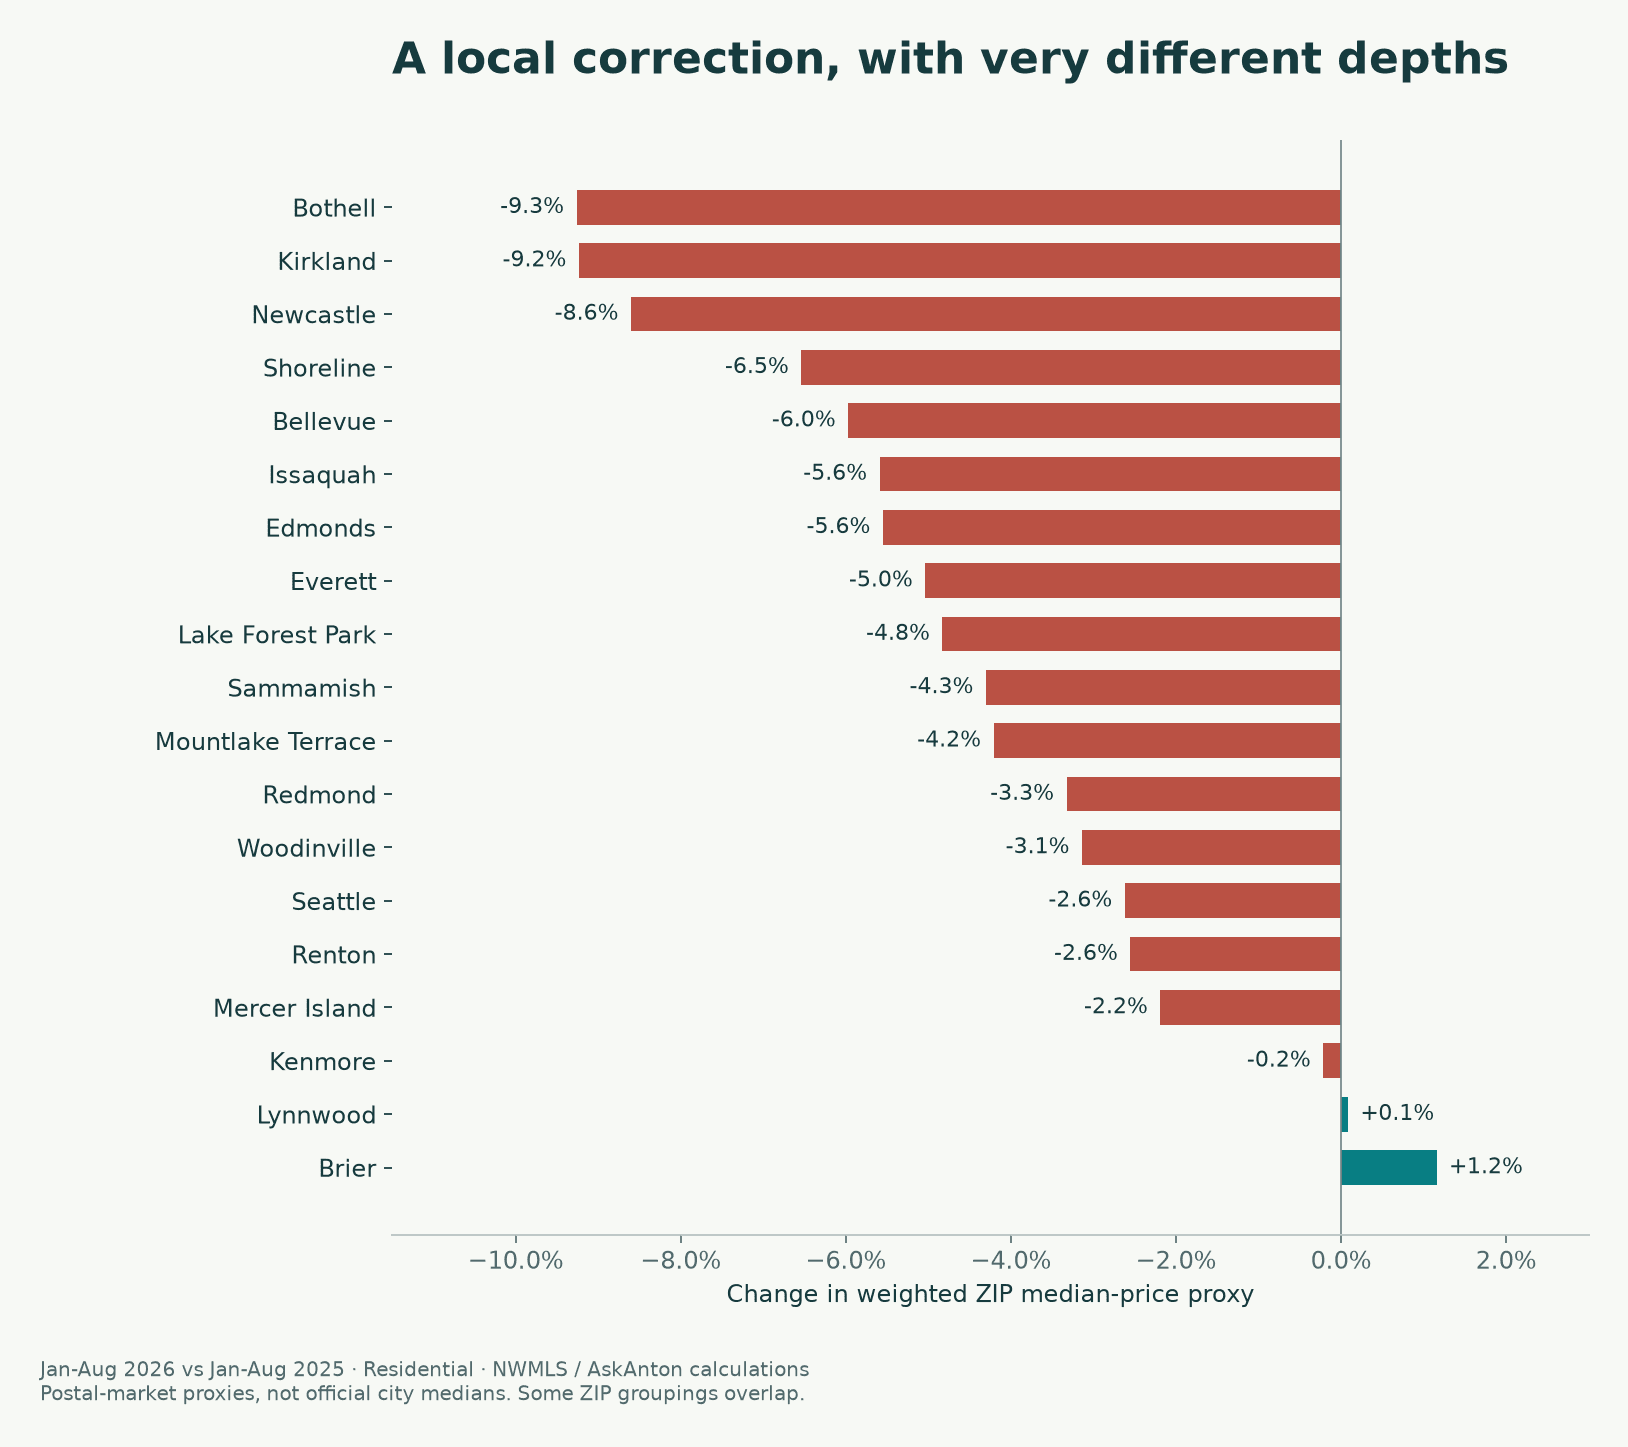
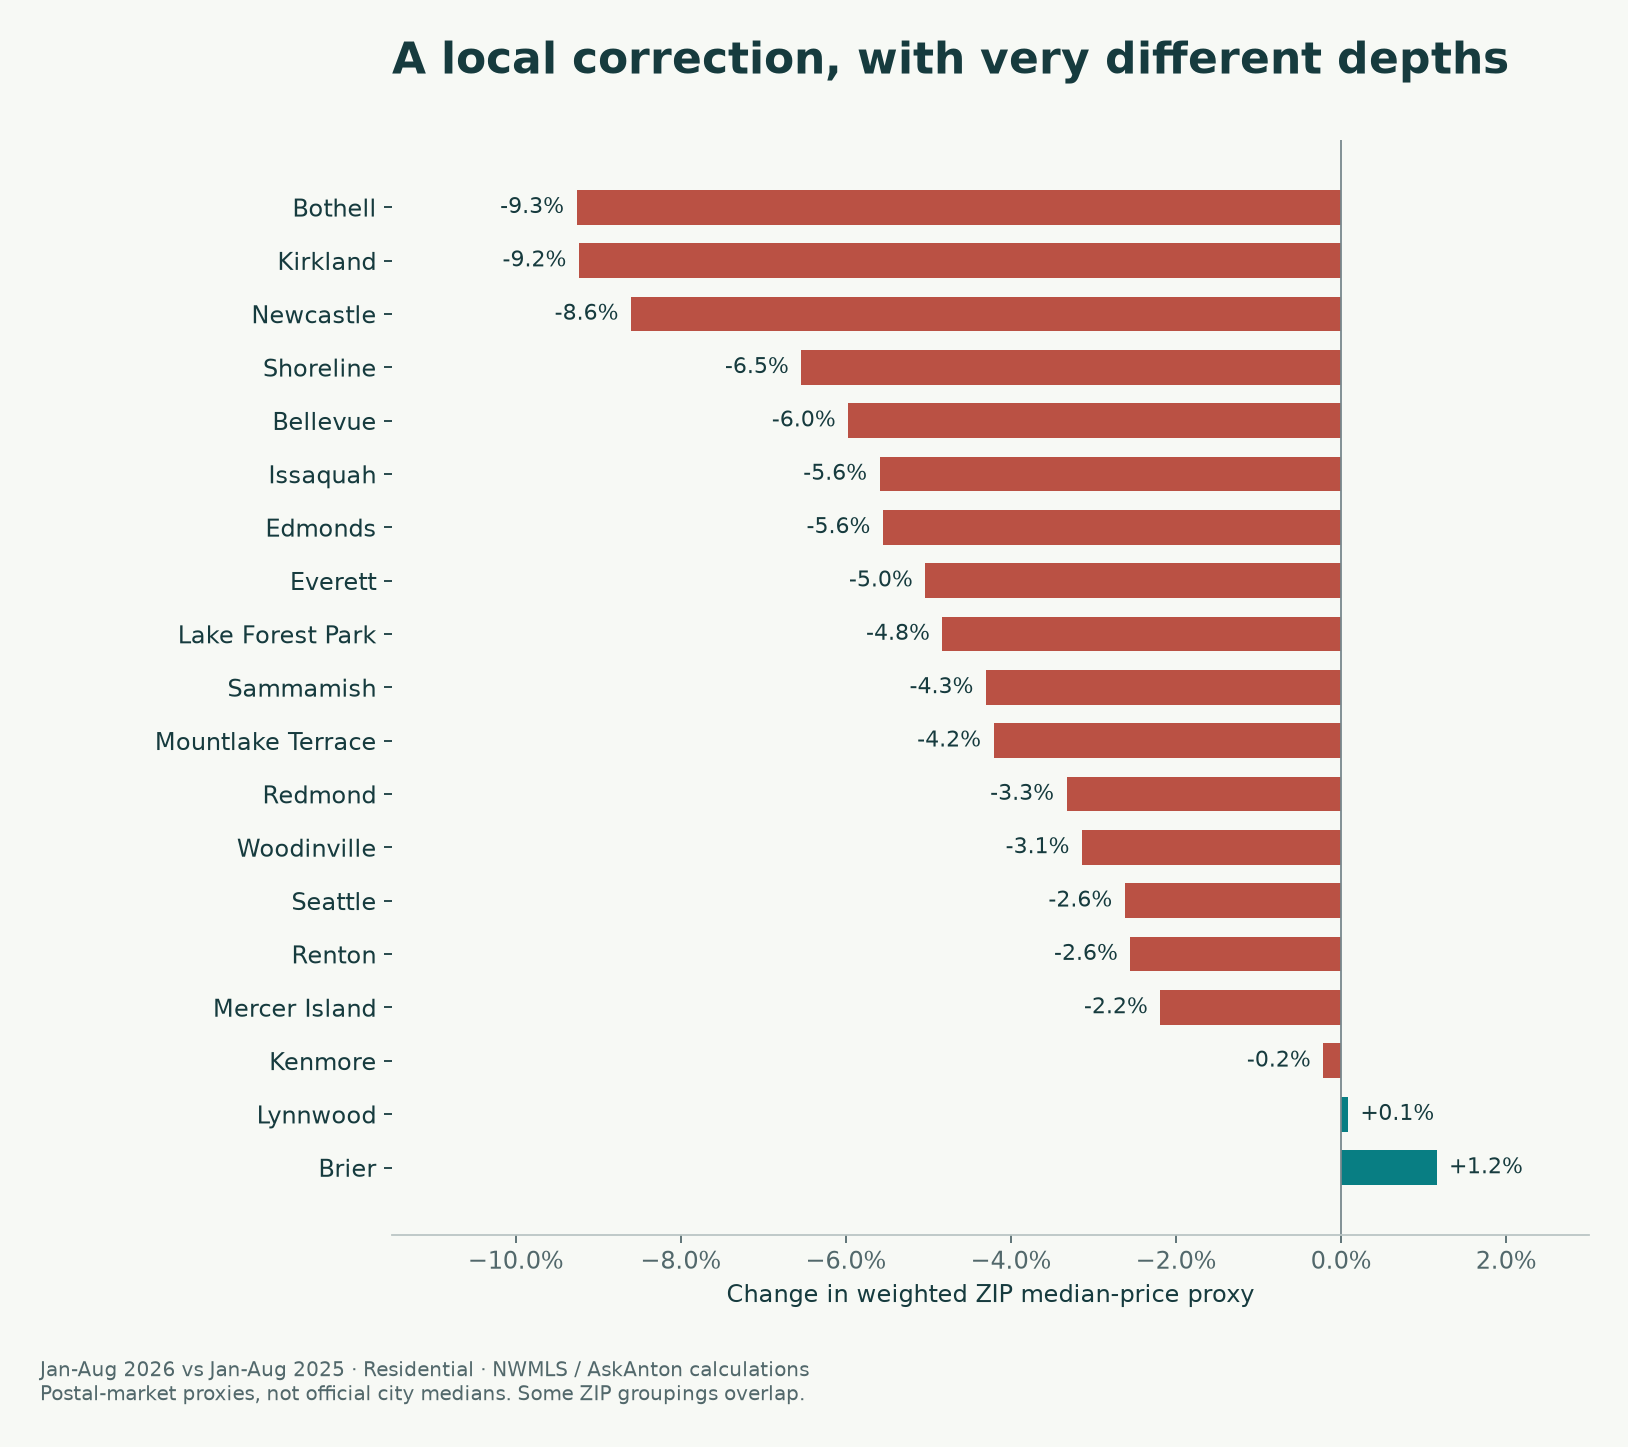
| Market / ZIP coverage | 2025 YTD | 2026 YTD | YTD change | August YoY |
|---|---|---|---|---|
| Bothell98011, 98012, 98021 | $1,172,755 | $1,064,106 | -9.3% | -7.5% |
| Kirkland98033, 98034 | $1,785,120 | $1,620,248 | -9.2% | -16.1% |
| Newcastle98059 | $1,121,500 | $1,025,000 | -8.6% | -29.6% |
| Shoreline98133, 98155, 98177 | $963,429 | $900,412 | -6.5% | +0.7% |
| Bellevue98004, 98005, 98006, 98007, 98008 | $2,206,547 | $2,074,754 | -6.0% | -1.8% |
| Issaquah98027, 98029 | $1,471,830 | $1,389,519 | -5.6% | -6.7% |
| Edmonds98020, 98026 | $1,122,479 | $1,060,154 | -5.6% | -8.4% |
| Everett98201, 98203, 98204, 98205, 98208 | $723,030 | $686,599 | -5.0% | -7.9% |
| Lake Forest Park98155 | $890,000 | $847,000 | -4.8% | +6.0% |
| Sammamish98074, 98075 | $1,790,821 | $1,713,739 | -4.3% | -7.0% |
| Mountlake Terrace98043 | $736,000 | $705,000 | -4.2% | -9.7% |
| Redmond98052, 98053 | $1,579,625 | $1,527,063 | -3.3% | -4.1% |
| Woodinville98072, 98077 | $1,525,988 | $1,478,065 | -3.1% | +11.1% |
| Seattle23 ZIPs; see methodology | $1,072,415 | $1,044,293 | -2.6% | -8.1% |
| Renton98055, 98056, 98057, 98058, 98059 | $940,316 | $916,299 | -2.6% | -12.1% |
| Mercer Island98040 | $2,510,000 | $2,455,000 | -2.2% | +8.2% |
| Kenmore98028 | $1,150,000 | $1,147,500 | -0.2% | -14.6% |
| Lynnwood98036, 98037, 98087 | $796,864 | $797,519 | +0.1% | +6.7% |
| Brier98036 | $865,000 | $875,000 | +1.2% | +10.6% |
Postal boundaries matter. Newcastle’s proxy uses 98059, which also includes Renton-area properties. Brier uses 98036, which is also in the Lynnwood grouping. Lake Forest Park uses 98155, which is also in the Shoreline grouping. These rows are not independent municipal samples; do not add their sales counts together.
Bothell: weakness across all three ZIPs.
Bothell’s residential decline is not confined to one ZIP. ZIP 98011 fell from $1,238,000 to $1,126,000 (−9.0%); 98012 fell from $1,075,000 to $1,000,000 (−7.0%); and 98021 fell from $1,324,000 to $1,152,500 (−13.0%). That makes the local pattern worth taking seriously. It still does not identify the reason each home sold or measure the change in the value of an identical home.
Bellevue and Kirkland: wealth is not complete insulation.
Bellevue 98007’s −13.2% YTD residential result challenges a simple “wealthy core markets are protected” story. Kirkland 98033 and 98034 were down 9.1% and 9.5% YTD, with August-only declines of 16.6% and 15.4%. At the same time, Bellevue’s ZIPs do not move together: 98008’s August median was up 1.7% while 98004 was down 18.1%. A few expensive transactions can make the monthly picture volatile.
Redmond, Sammamish and the wider region.
Redmond’s smaller decline is a relative difference, not proof of immunity. Its proxy combines 98052 and 98053, including territory beyond the city boundary. Sammamish’s proxy fell about 4.3%; Issaquah’s about 5.6%. Seattle, Renton, Everett and Edmonds also weakened, while Lynnwood’s YTD proxy was essentially flat. Use these comparisons to decide where to investigate further, then narrow to price range, size, condition and competing inventory.
04 / Beyond the sale price
More listings. Less demand growth. Longer selling times.
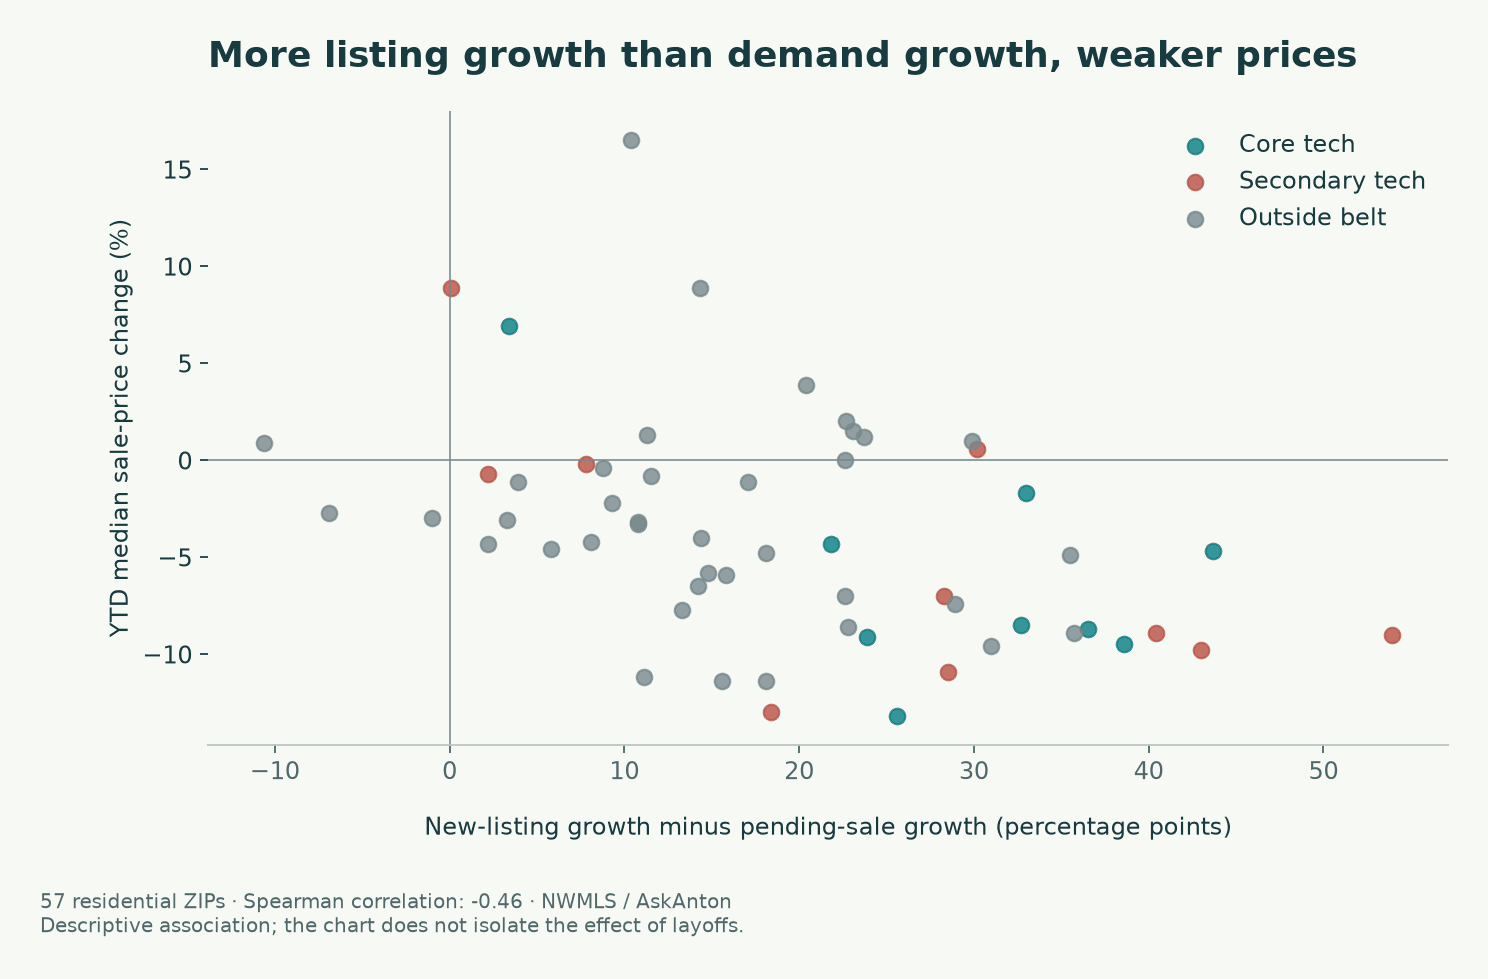
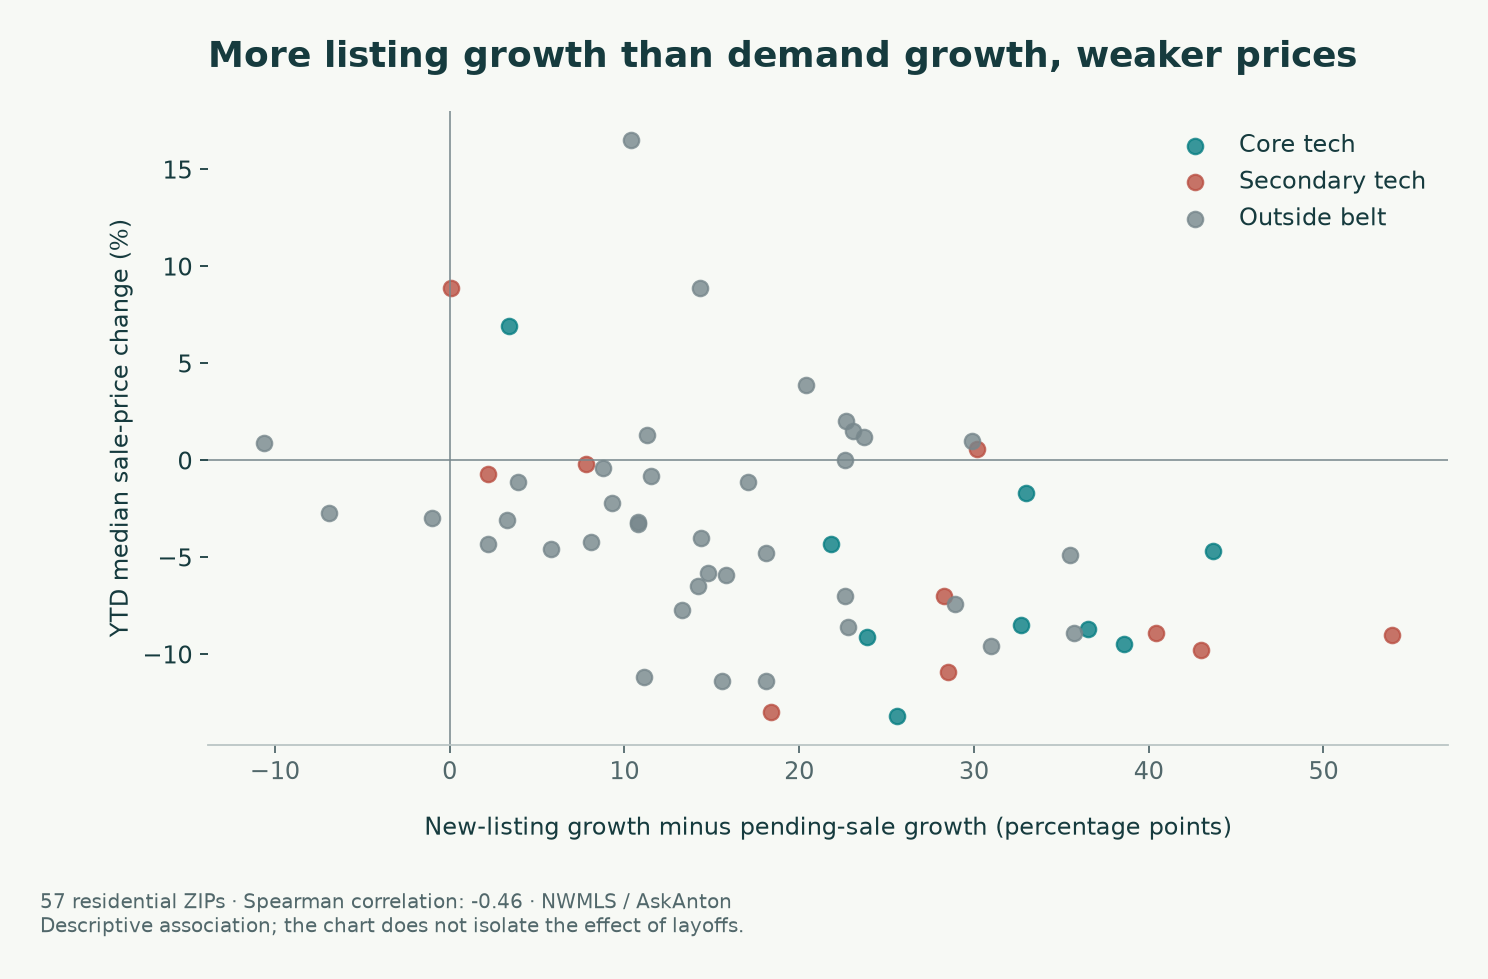
The clearest pressure signal is the mismatch between new-listing growth and pending-sales growth. A pending sale indicates a signed contract; it is not a completed closing. When incoming supply grows faster than that flow of contracts, sellers can face more competition even if the median sale price has not yet moved much.
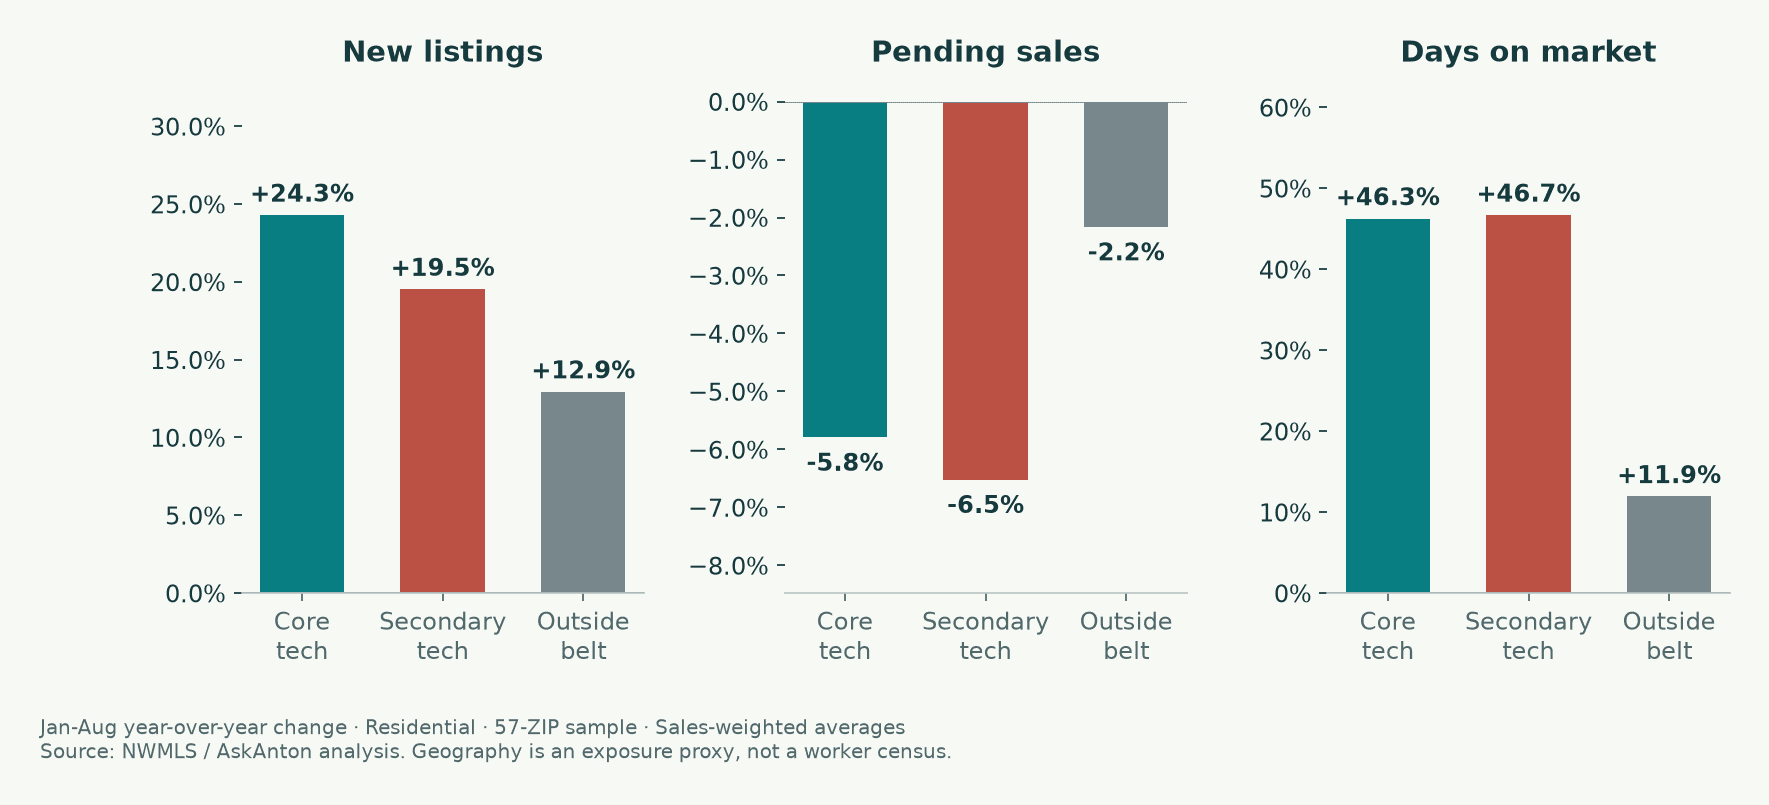
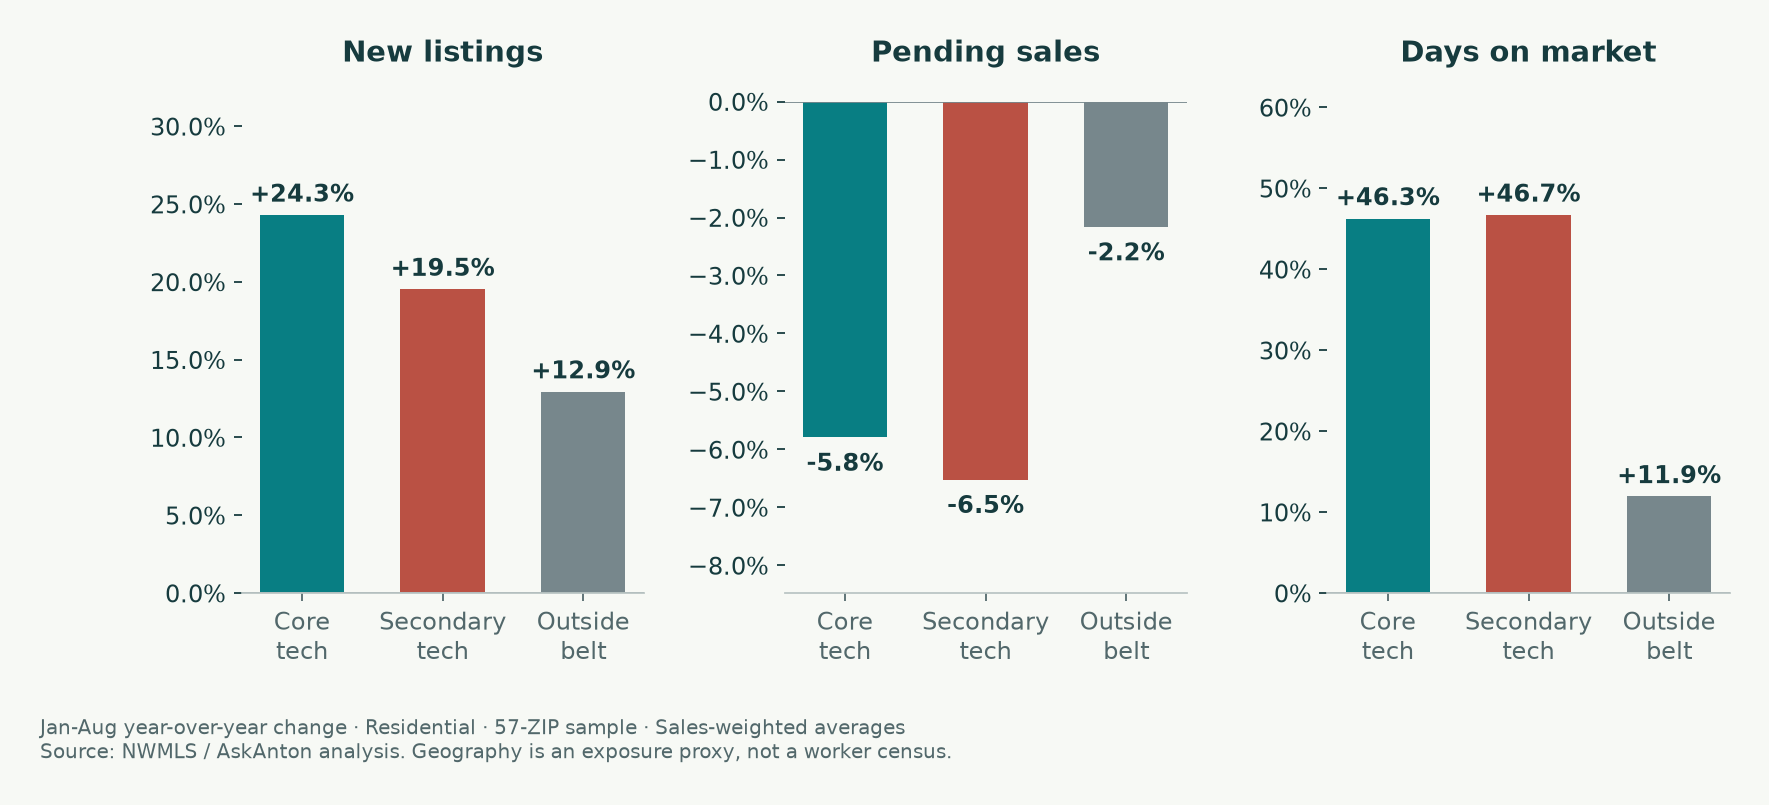
| Group | ZIPs | Price | New listings | Pending sales | Days on market |
|---|---|---|---|---|---|
| Core tech | 9 | -6.6% | +24.3% | -5.8% | +46.3% |
| Secondary tech | 10 | -5.9% | +19.5% | -6.5% | +46.7% |
| Outside belt | 38 | -2.8% | +12.9% | -2.2% | +11.9% |
The King County anchor.
The official King County residential report puts the YTD median at $957,000, down 3.5% from $992,000. YTD new listings rose 13.4%, pending sales fell 3.5%, closed sales fell 5.1%, and days on market rose from 23 to 28. In August, inventory increased from 3,801 to 5,313 homes (+39.8%) and months of supply rose from 2.6 to 3.8.
The condo picture is different: King County’s YTD condo median fell from $575,000 to $530,000 (−7.8%), while YTD closed sales fell 18.3%. August condo supply reached 6.2 months, compared with 3.8 months for residential. A condo buyer or seller should start with the condo segment rather than applying a detached-home narrative.
There is no Snohomish County aggregate in the supplied collection. The 26 Snohomish ZIP reports are available individually below. The source’s “Residential” and “Condo” categories remain separate throughout.
Concessions can change the effective deal.
NWMLS notes that its price and list-price figures do not account for sale concessions or downpayment assistance. A closing-cost credit, a builder incentive or another negotiated benefit can change the buyer’s economics without an equivalent reduction in the reported sale price. Compare the written terms as well as the price. A sale close to asking price also does not reveal every earlier price reduction.
05 / The employment connection
Tech demand can weaken before forced selling appears.
- 01 · Job uncertaintyHiring slows, a role disappears or compensation becomes less predictable.
- 02 · Household cautionA buyer delays relocating, trading up or committing a larger down payment.
- 03 · Less competitionFewer buyers pursue the available homes while listings accumulate.
- 04 · Pricing pressureMarketing time increases and some sellers change prices or terms.
This is a possible mechanism, not a measured sequence for the households in these reports. NWMLS FastStats contains no buyer-employer records, stock-compensation balances, immigration information or reasons for a move. Geographic exposure is a rough way to test a pattern; it cannot tell us who lost a job.
What the employment reporting adds.
Axios’s September 21, 2026 review identified at least 20 Seattle-area tech layoff rounds during the year, including roughly 2,200 Washington cuts at Amazon, 1,395 at Meta and 605 at Microsoft. Those are dated reported counts, not a complete year-end total or a count of households selling homes. WARN notices describe planned employment actions; announced and completed job losses can differ. Read the dated Axios report and use the Washington ESD WARN database to review notices and effective dates.
Hiring is a separate channel. GeekWire’s December 9, 2025 report on Indeed data recorded Seattle software-development postings at an index of 32 and data-and-analytics postings at 29 as of November 27, with February 1, 2020 equal to 100. That means approximately 68% and 71% fewer postings than the baseline—not that those shares of existing jobs disappeared. These are historical hiring indicators, not September 2026 readings. Source and dates.
Indeed’s 2026 hiring outlook, published in November 2025, emphasized uneven prospects across occupations and regions. It is useful background for why a high-income household might be cautious even while other sectors hire. It does not justify saying every technology employer has stopped hiring. Claims about an active hiring freeze or jobs moving out of state require employer-specific dates and evidence; the NWMLS reports do not measure either.
Redfin supplies a separate regional cross-check.
Redfin’s September 2 report described July Seattle-area sales down about 9%, median price down about 4% to $809,000, and inventory up about 17% year over year. It also reported pending sales down 15.6% and active listings up 16.7%, while describing stronger conditions in San Francisco. Those figures use Redfin’s geography, period and methodology; they should not replace August NWMLS ZIP statistics. Read Redfin’s report.
Redfin’s discussion points to reduced relocation and job switching as possible demand pressures. That supports investigating the employment channel, but an agent’s explanation and a regional comparison are not causal estimates. Mortgage costs, new construction, household wealth and the homes available at a particular price all matter too.
Commute, wealth, construction and visa uncertainty.
The original hypothesis was that proximity to major employers and accumulated wealth might cushion Redmond and Bellevue more than Bothell. The results are more complicated: some core ZIPs are deeply negative, and the price-adjusted regression finds similar weakness in the core and secondary groups. A starting home price is only a rough price-tier proxy; it is not a direct measure of household wealth.
Builder competition and commute requirements are sensible property-level questions. These reports do not separate new construction from resale or measure travel times, so they cannot establish that one city’s construction pipeline or commute caused its decline. Compare actual available alternatives before drawing that conclusion.
Employment-linked visa uncertainty can affect an individual household’s plans, but this dataset cannot quantify that effect. Do not infer a homeowner’s status, nationality, financial position or urgency from an address. Buyers and sellers should discuss their own timing and financing needs with the appropriate advisers.
06 / Test the stronger claim
Is the decline accelerating? The answer is local.
The strongest cumulative weakness is in the tech corridor, but the August comparison does not support a claim that the whole corridor was getting worse at an increasing rate. Core-tech ZIPs averaged −6.6% YTD and −5.5% in August; secondary-tech ZIPs averaged −5.9% YTD and −4.8% in August. Outside-belt ZIPs averaged −2.8% YTD and −4.9% in August.
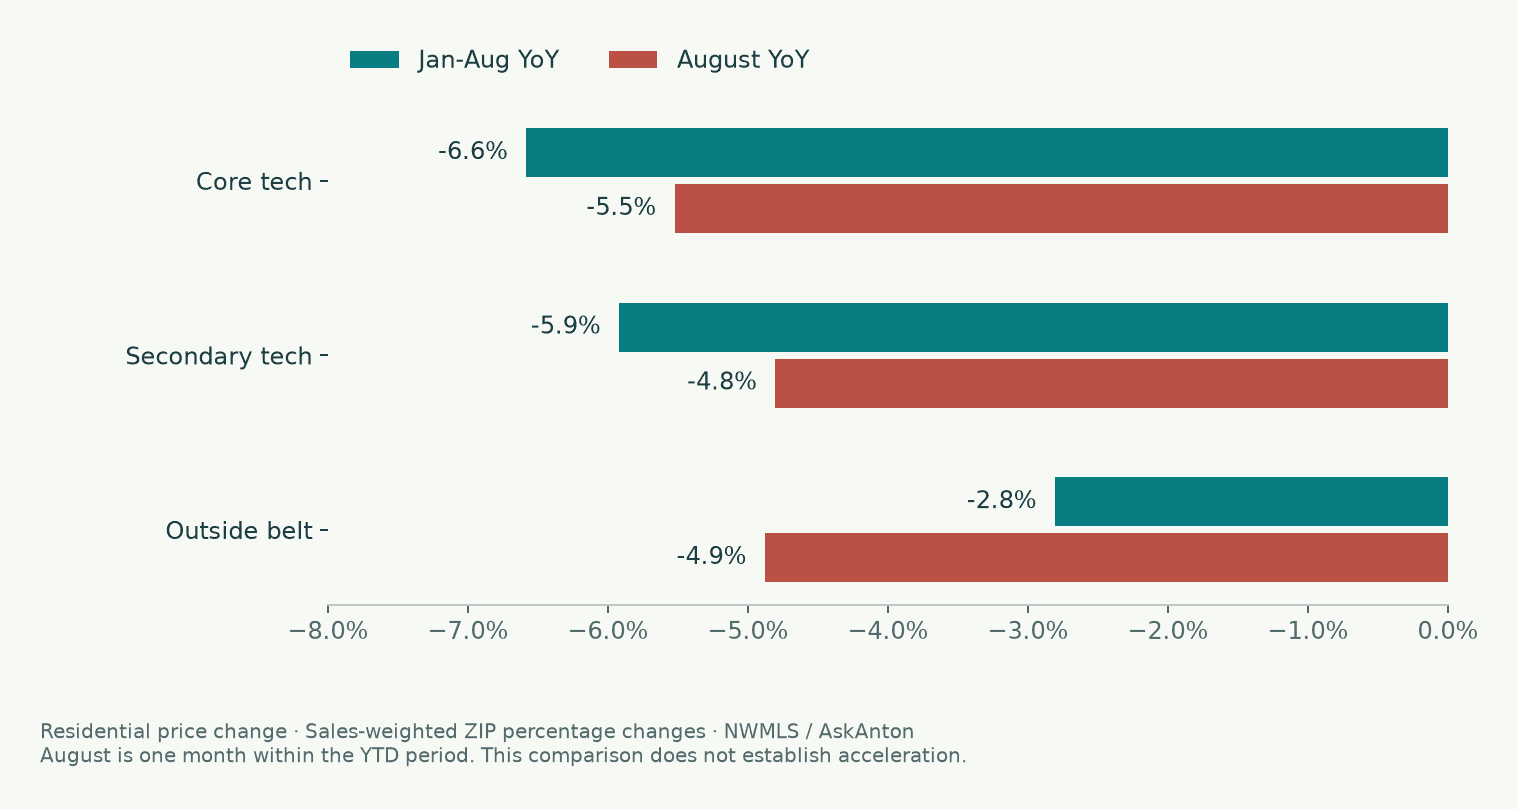
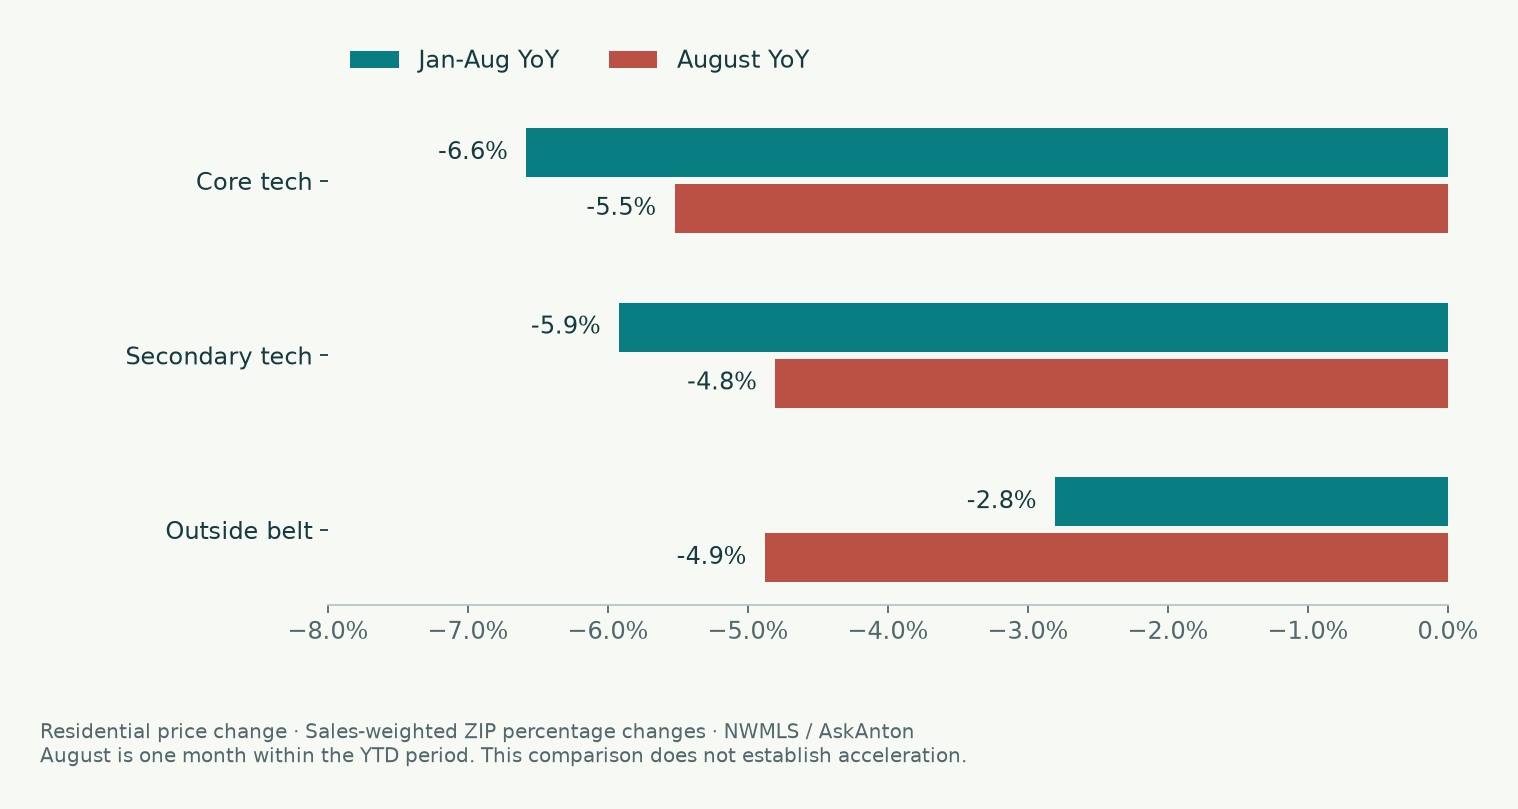
Kirkland’s postal proxy was weaker in August (−16.1%) than YTD (−9.2%). Seattle, Renton, Everett and Edmonds also had more negative August comparisons. Bothell’s August proxy (−7.5%) was less negative than its YTD result (−9.3%). These differences identify places to monitor. They do not establish that a repeatable monthly trend has changed.
Three measurements that must stay distinct: NWMLS YTD compares January–August with the same eight months a year earlier. August YoY compares one month with the same month a year earlier. January-to-August Zillow ZHVI measures a within-year change in an estimated value index. They answer different questions.
A stronger acceleration study would use a longer month-by-month series, account for seasonality and changing sales mix, and compare more directly measured employment exposure. The bottom-of-page lines in the original FastStats PDFs are rolling 12-month calculations, not the same series as the tables above.
From the livestream to your next decision
The missing buyer, the higher payment, and the opportunity to negotiate.
The most useful insight in the livestream is about a purchase that never happens. A household does not have to lose its home—or even lose a job—to change the housing market. It only has to decide that this is the wrong moment to move.
A job survivor can still become a missing buyer.
At 37:24 in the video, Anton reads a viewer’s account of surviving team layoffs and shelving a planned purchase above $2 million. That is a viewer-reported example, not a measured share of the market. It illustrates three separate channels: fewer new employees relocating into the region, existing employees delaying upgrades, and some households losing purchasing power after a job or compensation change.
For sellers, the implication is practical: an attractive home can face a smaller qualified buyer pool without its owner being distressed. For buyers, more choice is useful only if their own income and reserves can support the purchase. The NWMLS listing, pending-sale and marketing-time figures show where to investigate that imbalance.
A home can be worth more than you paid and still be hard to move out of.
The Marysville viewer’s question at 14:09 captures the lock-in problem: a household may need more space but hesitate to replace a low-rate mortgage. Appreciation since purchase, recent price declines, net sale proceeds and the next monthly payment are four different calculations.
Your current home
- Use a realistic sale-price range.
- Subtract the actual loan payoff and estimated selling costs.
- Keep moving costs and needed cash reserves separate.
- Use the current payment from your statement.
Your next home
- Use the down payment that remains after those costs.
- Get a written loan estimate for the new purchase.
- Include taxes, insurance, dues and upkeep.
- Compare the payment increase with what the move solves.
A lower price on the next home may help, but it does not automatically offset a higher rate or a larger loan. There is also no requirement to use every dollar a lender will approve. Begin with a payment and reserve level the household can sustain.
What changes your monthly payment?
Try a price change and a rate change separately. The starting values are illustrations, not today’s rates, insurance quotes or a loan offer. All scenarios use a new 30-year fixed-rate loan.
| Scenario | Down payment | Principal & interest | With entered expenses | Monthly savings |
|---|---|---|---|---|
| Your starting scenario$900,000 · 6.5% | $180,000 | $4,551 | $5,451 | $0 |
| If the price were 5% lower$855,000 · 6.5% | $171,000 | $4,323 | $5,223 | $228 |
| If the rate were 1 point lower$900,000 · 5.5% | $180,000 | $4,088 | $4,988 | $463 |
The down-payment percentage stays constant. Taxes, insurance, HOA dues and mortgage insurance stay at your entered amounts to isolate the price/rate effect; actual quotes can differ. Mortgage insurance is not estimated automatically. Rates below 1% compare with 0%. Excludes closing costs, points, maintenance, utilities and any tax benefit. A lower future rate or refinance is not guaranteed. Your entries stay in this calculator and are not sent to chat.
Why include these expenses? CFPB explains the difference between principal and interest and total monthly costs.
Talk through my buying or selling plan →Negotiating room is a package of terms.
At 42:09, Anton describes a first-home purchase involving a rate buydown, closing-cost assistance and contingencies. It is one transaction example, and the buyer was a broker; compensation and concessions from that transaction are not promises to every buyer. The useful lesson is to compare the full deal.
| Term | Buyer question | Seller question |
|---|---|---|
| Lower price | How does it change cash and loan size? | Will it reach a more active price bracket? |
| Closing-cost credit | Can my loan use the credit as proposed? | What are my net proceeds after the credit? |
| Rate buydown | Is it temporary or permanent, and what is the later payment? | Does the cost solve this buyer’s financing obstacle? |
| Inspection and repairs | What condition risk remains after inspections? | Which repairs or credits create a workable agreement? |
| Timing and contingencies | Can I complete the financing and move on time? | How certain is the closing under these terms? |
A smaller monthly payment can come with a larger upfront cost. Compare written lender estimates alongside the purchase terms. CFPB’s mortgage-cost explanation is a useful starting point.
More homes for sale and a long-term housing shortage can coexist.
Inventory measures homes competing for buyers in the current market. Housing need includes households that may not be able to afford those homes, plus future growth. Washington Commerce’s 2023 projection called for approximately 1.1 million additional homes over 20 years, with more than half needed at lower income levels. That is a statewide planning estimate, not this month’s available inventory or a forecast for your home’s price. Read the Commerce projection.
This helps reconcile two themes in the video: buyers can have more negotiating room now while construction and affordability remain long-term problems. A shortage of affordable housing does not ensure that a particular expensive listing will sell at its asking price.
Should you buy this winter, wait for spring, or plan for 2027?
At 49:02, Anton discusses seasonal negotiation and a conditional outlook for 2027. Treat winter as a period to investigate seller flexibility, not an automatic discount. There may also be fewer suitable homes. The supplied August reports alone cannot establish the best future month to buy.
| If conditions develop this way… | Buyer response | Seller response |
|---|---|---|
| Payments stay high; hiring stays weak | Keep reserves strong; compare patient offers. | Compete on current value and workable terms. |
| Rates fall; qualified demand returns | Recheck affordability and competing offers together. | Watch actual showings and contracts before assuming a rebound. |
| Rates fall; job uncertainty persists | Do not treat the rate alone as a reason to commit. | Expect the response to vary by price tier and location. |
| Nearby inventory rises faster than contracts | Compare concessions across truly similar alternatives. | Review price, presentation and timing promptly. |
Mortgage rates and the 10-year Treasury are related, but their spread is not fixed. Adding two percentage points to a Treasury yield is a rough discussion shortcut, not a loan quote. A future refinance, a policy change or an end to a conflict should not be necessary for today’s purchase to work. Freddie Mac explains the changing mortgage–Treasury spread.
Three distinctions that make the video easier to use.
- Original asking price versus current list price. The seasonal discussion references original-list-price ratios. The supplied FastStats field is labeled “Percent of List Price Received.” These should not be treated as interchangeable or as a guaranteed discount on your next offer.
- One chart view versus another. The video changes dates, property filters and rolling periods. This guide anchors its tables to the supplied August reports: King residential supply is 3.8 months; condos are 6.2 months. A different number on a livestream chart needs its own matching settings.
- Tax treatment versus spendable cash. Homeownership does not automatically produce a tax benefit. Mortgage-interest deductions depend on eligibility, itemizing and limits. Keep assumed tax savings out of the payment calculator and review your circumstances with a tax professional. IRS Publication 936.
07 / The buyer’s guide
Use the softer market to make a better decision.
More choice can improve a buyer’s position, but the advantage only helps if the home, payment and timing work for the household. A market correction is not a reason to abandon due diligence or to assume that every seller will negotiate.
- Define a budget that survives uncertainty. Separate dependable income from bonuses, anticipated stock gains or a hoped-for refinance. Include taxes, insurance, association dues, maintenance and cash left after closing. Ask the lender to compare the actual proposed financing terms.
- Choose a useful comparison set. Start with the ZIP and property category, then narrow to the home’s neighborhood, size, condition, lot, price tier and commute needs. A county median is too broad to price a specific home.
- Look at the competition the seller sees today. Recent closed sales show achieved prices; active alternatives show your choices; pending homes indicate where buyers are acting. This report is an August snapshot, so obtain current listing-level evidence before making an offer.
- Negotiate the entire purchase. Compare purchase price, seller credits, financing conditions, inspection rights, repair allocation and closing timing. Ask the lender how a proposed credit affects the loan. A headline incentive may carry conditions that matter more than its size.
- Keep a property-specific walk-away point. A lower price cannot cure every location, condition or cash-flow problem. Consider the cost of repairs and the time you expect to own the home; a short holding period leaves less room to absorb transaction costs and price changes.
- Recheck your assumptions before closing. Confirm the financing, required funds, property condition and contract deadlines with your transaction team. If employment or income changes, tell the lender promptly so the plan can be reassessed.
Should you wait for a lower price?
Waiting can make sense when income is uncertain, the move is flexible or the available homes do not fit. Buying can make sense when the property and full cost are sustainable and the home serves a longer-term need. This dataset cannot identify the market bottom, predict mortgage rates or determine the right decision for a particular household.
08 / The seller’s guide
Price for the buyers who are in the market now.
A sale does not require every regional indicator to improve. It does require a realistic match between the property, its price and the people who can buy it. When buyers have more alternatives, yesterday’s strongest comparable sale may be an incomplete guide.
- Build the competitive set before choosing a price. Review the most relevant closed and pending sales, current competing homes, recent reductions and new-construction alternatives. Separate superior features from improvements that buyers may not value dollar for dollar.
- Set the listing up to answer buyer concerns. Clear photos, accurate information, practical showing access and a well-maintained presentation reduce uncertainty. Resolve known issues thoughtfully and coordinate disclosure questions with your broker or adviser.
- Agree on a response plan in advance. Set a review date and decide what evidence will prompt a change: qualified showings, repeat visits, offers, objections and competing price moves. No single number of days guarantees that a price is wrong, but an unexamined listing can lose time.
- Evaluate net proceeds and execution risk. The highest offer is not always the most useful offer. Compare credits, repairs, financing conditions, appraisal exposure, contingencies and timing. Ask for a written estimate of proceeds under the options you are considering.
- Coordinate the sale with the next home. A weaker sale price can coincide with better purchase terms elsewhere. Compare both transactions, moving costs and any overlap in housing expenses. Avoid making the next commitment depend on an untested sale assumption.
- Make timing decisions early if income changes. Review the household’s cash runway and discuss options before a deadline forces a rushed decision. The fact that layoffs exist in the region does not mean a particular owner needs to sell.
Price reduction or concession?
A price change may reach a new search bracket; a concession may address the buyer’s upfront costs or another specific obstacle. The right choice depends on the actual pool of buyers, lender rules and contract terms. Compare the net outcome rather than choosing an incentive because it looks large in an advertisement.
09 / What to monitor
Watch the next contracts, not just the next headline.
Signs of stabilizing conditions
- Pending demand begins catching up with new listings.
- Comparable homes sell with less marketing time.
- Inventory growth moderates within the same price segment.
- Hiring and relocation confidence improve in dated employment evidence.
Signs of continued pressure
- New listings repeatedly outpace contracts.
- Price reductions and concessions spread among competing homes.
- Marketing time lengthens across multiple comparable periods.
- Employment uncertainty persists and buyer budgets become more cautious.
These are monitoring questions, not forecasts. Follow several months using consistent definitions, and keep residential, condo, new-construction and resale comparisons separate where the source allows. A single monthly median can move sharply because the mix changed.
10 / The complete report collection
Explore every supplied NWMLS market.
Search all 108 report areas and switch between residential and condo statistics. Select a report to see its full set of monthly and YTD metrics. Small sales samples deserve extra caution; “not reported” is different from zero.
Showing 12 of 108 matching reports · City searches use the postal groupings listed in the methodology. ZIP boundaries are not city boundaries.
| Report | 2025 YTD median | 2026 YTD median | YTD change | August YoY | 2026 YTD sales | August supply |
|---|---|---|---|---|---|---|
| King | $639,990 | $660,000 | +3.1% | +6.4% | 199 | 3.1 months |
| King | $510,000 | $505,000 | -1.0% | -9.5% | 99 | 3.7 months |
| King | $640,000 | $665,000 | +3.9% | -12.7% | 149 | 4.1 months |
| King | $3,725,000 | $3,549,500 | -4.7% | -18.1% | 112 | 9.3 months |
| King | $2,000,000 | $2,138,000 | +6.9% | +64.7% | 85 | 3.7 months |
| King | $1,942,500 | $1,773,250 | -8.7% | -4.2% | 212 | 4.3 months |
| King | $1,625,000 | $1,410,000 | -13.2% | -11.8% | 55 | 4.5 months |
| King | $1,695,000 | $1,551,225 | -8.5% | +1.7% | 151 | 3.7 months |
| King | $779,950 | $754,950 | -3.2% | -7.6% | 166 | 4.2 months |
| King | $1,238,000 | $1,126,000 | -9.0% | -13.1% | 115 | 6.4 months |
| Snohomish | $1,075,000 | $1,000,000 | -7.0% | -9.5% | 376 | 4.5 months |
| King | $999,999 | $995,000 | -0.5% | +16.4% | 83 | 5.4 months |
Full report: 98021 · residential · Snohomish collection
| Metric | Aug 2025 | Aug 2026 | Change | YTD 2025 | YTD 2026 | Change |
|---|---|---|---|---|---|---|
| New listings | 56 | 42 | -25.0% | 359 | 401 | +11.7% |
| Pending sales | 32 | 31 | -3.1% | 239 | 223 | -6.7% |
| Closed sales | 35 | 26 | -25.7% | 242 | 206 | -14.9% |
| Days on market until sale | 34 | 31 | -8.8% | 20 | 28 | +40.0% |
| Median sale price | $1,180,000 | $1,177,000 | -0.3% | $1,324,000 | $1,152,500 | -13.0% |
| Average sale price | $1,236,738 | $1,152,679 | -6.8% | $1,312,561 | $1,157,990 | -11.8% |
| Percent of list price received | 98.7% | 98.7% | 0.0% | 100.6% | 99.0% | -1.6% |
| Inventory of homes for sale | 87 | 103 | +18.4% | — | — | — |
| Months of supply | 3 | 4 | +33.3% | — | — | — |
— means not reported. Source percentages may reflect rounding. Prices and list-price ratios exclude concessions and downpayment assistance; small samples can produce extreme changes. The source reports do not provide YTD inventory or YTD months of supply.
11 / Evidence and method
What the regression tells us—and its limits.
The analysis selects unique residential ZIPs from the 19 postal-market groupings above, then requires an average of at least 25 YTD closed sales across 2025 and 2026. That leaves 57 ZIPs. Other ZIPs in the full report collection are not included in the regression, even where they have sufficient sales; this is a selected comparison sample, not a model of every market in both counties. The selected groups contain nine core-tech, ten secondary-tech and 38 outside-belt ZIPs. “Outside belt” does not mean no technology workers live there. All three are geographic classifications chosen for this analysis.
| Model | Tech vs outside gap | R² | Uncertainty / interpretation |
|---|---|---|---|
| 18 postal-market comparison | −2.49 points | 0.177 | Overlapping postal geographies |
| 57 ZIPs, equal weight | −2.47 points | 0.040 | 95% bootstrap: −5.68 to +0.86 |
| 57 ZIPs, sales weighted | −3.42 points | 0.089 | 95% bootstrap: −6.03 to −0.62 |
| Starting-price control | Core −2.45; secondary −2.42 | 0.101 | Log starting median is a rough proxy |
| Price + listing/pending gap | Core −0.73; secondary −1.09 | 0.173 | Supply/demand may be part of the mechanism |
The equal-weight model’s permutation p-value is 0.134, and its bootstrap interval includes zero. The sales-weighted result is more negative, but its R² is still only 0.089: this classification leaves most ZIP-level price variation unexplained. Weighting changes which markets matter most; it does not transform a descriptive comparison into proof of causation.
Removing all three Bothell ZIPs leaves a weighted gap of −2.57 percentage points. Removing one tech ZIP at a time keeps the gap negative, ranging from −3.86 to −2.94 points. Those checks show that the observed pattern is not entirely dependent on a single ZIP. They do not correct every possible confounder or make the geographic groupings objective.
New-listing growth minus pending-sales growth has a Spearman correlation of −0.46 with YTD price change. Adding that imbalance reduces the remaining tech coefficients. This is consistent with a supply-and-demand channel, but controlling for a potential channel of the effect can obscure the overall relationship. Do not interpret the smaller coefficients as evidence that employment does not matter.
The exploratory August-versus-YTD test produces a positive tech coefficient of about 3.2 points and a permutation p-value of 0.582. It does not establish corridor-wide acceleration. The two periods overlap, and transaction medians remain sensitive to which homes close.
How the numbers were constructed.
- Source and cutoff. NWMLS FastStats Local Market Updates for August 2026, current as of September 1 and supplied on September 29. The folder has one King County report, 81 King ZIP reports and 26 Snohomish ZIP reports: 108 PDFs and 216 property-category records.
- Primary comparison. January–August 2026 versus January–August 2025. The published one-decimal source percentages are preserved in individual report rows. All 11,664 metric fields across the 108 PDFs were reconciled against the extraction, including 1,296 median-price fields.
- Postal-market proxy. Each ZIP receives a fixed weight equal to its average 2025 and 2026 YTD closed sales. Apply those weights to ZIP medians in each comparison year, renormalizing over ZIPs with a reported value for each field, then calculate the percentage change between the weighted values. A weighted mean of medians is not the pooled median of all transactions.
- Group charts. These use sales-weighted averages of each ZIP’s reported percentage change. That differs from calculating the percentage change between weighted median-price levels; the two figures need not match exactly.
- Regression sample. The 57-ZIP model uses unique ZIP observations after the minimum-sales filter. The 18-market comparison omits Everett to match the prior Zillow comparison and includes overlapping postal geographies. Treat the unique-ZIP analysis as the more useful sensitivity check.
- Interpretation. Closed-sale medians reflect the mix of homes sold. They are neither repeat-sales indexes nor individual appraisals. Small samples, luxury closings, condo project mix and rounding can produce large changes. No individual-level employment linkage or direct wealth measure is included.
View every analytical group and postal-market ZIP definition
Core tech: 98004, 98005, 98006, 98007, 98008, 98033, 98034, 98052, 98053.
Secondary tech: 98011, 98027, 98028, 98029, 98072, 98074, 98075, 98077, 98012, 98021.
Outside belt: 98040, 98055, 98056, 98057, 98058, 98059, 98102, 98103, 98105, 98106, 98107, 98108, 98109, 98112, 98115, 98116, 98117, 98118, 98119, 98122, 98125, 98126, 98133, 98136, 98144, 98155, 98177, 98199, 98020, 98026, 98036, 98037, 98043, 98087, 98201, 98203, 98204, 98208.
Bothell: 98011, 98012, 98021.
Kirkland: 98033, 98034.
Newcastle: 98059.
Shoreline: 98133, 98155, 98177.
Bellevue: 98004, 98005, 98006, 98007, 98008.
Issaquah: 98027, 98029.
Edmonds: 98020, 98026.
Everett: 98201, 98203, 98204, 98205, 98208.
Lake Forest Park: 98155.
Sammamish: 98074, 98075.
Mountlake Terrace: 98043.
Redmond: 98052, 98053.
Woodinville: 98072, 98077.
Seattle: 98101, 98102, 98103, 98104, 98105, 98106, 98107, 98108, 98109, 98112, 98115, 98116, 98117, 98118, 98119, 98121, 98122, 98125, 98126, 98134, 98136, 98144, 98199.
Renton: 98055, 98056, 98057, 98058, 98059.
Mercer Island: 98040.
Kenmore: 98028.
Lynnwood: 98036, 98037, 98087.
Brier: 98036.
Where Zillow fits.
Zillow describes ZHVI as a measure of typical home value and appreciation, with different property-type and geographic series. It can help check whether a transaction-median shift is also visible in a value index. The prior research’s approximate January-to-August Zillow calculations use a different time comparison from this NWMLS YTD analysis, so this guide does not splice them into one price trend. Zillow definitions and data.
The full aggregate CSV and machine-readable method and model results are available without signup. Statistical outputs are carried from the supplied research; the source reconciliation checks the extracted report fields, not a causal interpretation.
12 / Video transcript
Transcript of the September 29 livestream.
The full caption transcript supplied by Anton is below, grouped into readable paragraphs. Wording is retained as provided and may contain caption errors. Statements in the livestream reflect the speaker’s views; the sourced analysis above distinguishes verified figures from interpretation.
8,544 words · Full recording through 61:31 · Select a section to read it. Timestamps open that moment on YouTube.
0:00–5:00 Read transcript
0:00 ↗has been pressed. It is spinning around in a circle and it says it is live. Hi, I'm Anton Stettner. I was asked the question this week, is tech affecting home prices here in the Seattle Metro? What is tech doing to us? Or more importantly, what is Washington State doing to us? What is the politicians and their ideology doing to us that's affecting tech?
0:27 ↗I'm For those of you that don't know, tech is about twenty two percent of the economy here in Washington state. That's right. Like one in five jobs. And so when tech changes, it affects our whole economy here in Washington state. And we've got big giants here, Amazon, Microsoft. You've got Google. You've got Facebook. You have a whole tech ecosystem here in Washington State.
1:02 ↗And today we're just going to answer the simple question. How is tech affecting housing? I'm Anton Stettner. I've sold a bunch of real estate for literally decades here in the Seattle Metro. I'm a nerd. I like making content. I like talking about data and the numbers. and i hope you do too so drop your questions and comments below right into the chat as we're doing this live and then if you watch this on the replay drop any questions and comments below about which areas which cities which zip codes which neighborhoods and we will happily provide you data now the data i'm going to share with you today i will uh put a link in the pinned comment probably with the same title, to our new website, AskAnton.com.
1:46 ↗It's only eighty percent finished, so it's not perfect. But we're going to put up a copy of the data that I am sharing with you today. Because going back to this idea is really what is happening here in the Seattle metro? What's changing? Because clearly the housing market is changing. And you've got home prices down year over year. So I was in here looking at the MLS.
2:17 ↗And I'm just going to pull up King County for a second. And if you look at King County and you look at the median prices, you can see that we're basically trending right now in a slightly downward direction. the question was well how much of that is tech affecting i'm going to tell you that tech is massively affecting the market here and that the the story is very simple sales are down prices are slightly declining the amount of available inventory is up buyers are getting more of what they want which has been really rare for our area And it's getting worse.
2:58 ↗Now, this isn't just a tech story. Of course, it is a interest rate story. We've got the the ten year treasury. That is just oh, my ridiculousness. That's just I mean, it's just skyrocketed. This should have stopped here at about five percent. The ten year treasury is what affects our thirty year fixed debt. And the reason this is so high is because of the Strait of Hormuz.
3:31 ↗There is still too much oil and conflict going on here. This is causing oil prices to rise, diesel prices to rise. But here locally, we've got more stories, though. We've got Asha. It's important email was sent to all employees at Xbox. Anyone else play Xbox? My name is Anton. I play video games. I play Xbox. What's your favorite video game? I am a first-person shooter.
4:01 ↗I play Call of Duty. I don't have time to learn multiple video games. I'm too busy. So I play one video game at a time and that's all I play so I can be decently good so when I'm fighting against the other thirteen-year-olds on the internet, I'm talking age-wise and maturity, that I'm decent and I don't get... And my assistant, Sasha, who is on a WhatsApp Live, just commented back and said, and that's probably the only aspect of your life where you do one thing at a time.
4:40 ↗But moral of the story is Xbox. And we all love them. I mean, they're here. You can see that I've made the difficult decision to reduce our team by approximately three thousand two hundred people throughout fiscal year twenty seven. This will include approximately sixteen hundred role eliminations today.
5:00–10:00 Read transcript
5:00 ↗In addition, four studios will leave Xbox to new management. So. Yes, I get it. The video game industry is changing, but also this is tech having problems in our area. Let's look at GeekWire. GeekWire just literally said this week, Microsoft cuts hundreds more jobs, shifts Halo to Activision and Xbox overhaul. Ari Hoffman earlier this year, Microsoft eliminating forty eight hundred rolls, about two point one percent of its global workforce.
5:42 ↗I love this commenter right here. Starbucks is leaving. Boeing is moving engineering to South Carolina. I don't care. I will tax every last business out of Washington. And it shows a picture of Bob Ferguson. When you look around, though, and you go, wait a second, is this just Washington state? Are we losing part of our tech industry right now? Maybe this is happening in other areas.
6:08 ↗Well, Redfin had a good article about this. Redfin showed us San Francisco housing market booms while Seattle slumps. Well, if it was just tech and if it was just the AI doom narrative that it's all falling apart and AI is coming for jobs. P.S. I'm sick of hearing that crap. And it's not happening. then it would be happening in San Francisco too.
6:37 ↗You would see it happening in San Francisco, except for what's happening in San Francisco is home sales jumped nine percent year over year in San Francisco while they fell nine percent in Seattle. This article is from September second, beginning of the month. Both West Coast cities are packed with a highly paid tech workforce and big tech name employers. We also face a lot of the same restrictions on housing and zoning and just massive red tape.
7:09 ↗So prices are rising in San Francisco while they're falling here in the Seattle Metro. For those of you that are just joining us, feel free to drop questions or comments about specific areas. For those of you watching on the replay, drop it and we'll come back and we'll answer those. But I want to show you more of this data. Because pending sales are down double digit and active listings are up double digit.
7:36 ↗Prices are the last thing to move. So what happens is like the demand moves first. And as the demand moves, the demand then causes the prices and the activity to change. Now, the demand is influenced by global economic factors, by the price of oil, by inflation, by the uncertainty. I'm not discounting that. But what I'm telling you here is we are seeing it worse in the Seattle metro because of tech.
8:07 ↗And I'm going to go into one city specifically that blows my mind how much it has changed, which was kind of my hypothesis for this whole live that we are going through. Essentially, we have more homes coming on the market and fewer buyers stepping up to purchase them. Axios, September, the relentless drip of Seattle's tech layoffs. A giant layoff may grab headlines, but the tech sector is also enduring a seemingly relentless drip of smaller cuts.
8:46 ↗Fifty jobs here, a hundred jobs here. And I need to reopen. Yeah, I didn't write that number. I got to reopen my chat, my chat GPT. What's your favorite AI program? Like, are you a chat GPT fan? Are you a Claude fan? Grok? Do you like running your own hardware, Hermes? What are you doing right now with AI? Now, while I open this in the background, There it is.
9:20 ↗That's what I was looking for. Through September, twenty twenty six. We have twenty. Tech layoff rounds. Amazon twenty two hundred. Meta fourteen hundred. Microsoft six oh five. Through August eighteenth. Nine thousand. Twenty-seven layoff notices have been filed in King County and the surrounding. About six thousand seven hundred and sixty-six. Seventy-five percent were in the information sector, a.k.a. tech.
10:00–15:00 Read transcript
10:00 ↗And you also saw it affecting T-Mobile, Expedia, Snap. I mean, these are all you know, massive, big companies in our area. And what's happening too is when we see these tech layoffs, they are high-paying jobs. And so those high-paying jobs are affecting Bellevue, Redmond. They're affecting King County. They're affecting Bothell. I got to give you the spoiler alert. Bothell's obliterated. Bothell and, hold on, which one was it?
10:42 ↗It's Bothell and I think Redmond. No, Bothell and Bellevue, nine eight zero two one and nine eight zero zero seven. Thirteen percent in Bothell, thirteen point two in Bellevue. Oh my goodness. Those are big numbers. And so I said, you know, I did a little more research and I was like, well, what's been happening? Washington state is experiencing tech layoffs at the second highest in the country.
11:19 ↗Ladies and gentlemen, this is political ideology, not surviving economic reality. Our politicians need to understand that our success of the past is not a guarantee of success in the future. And so many businesses came to Washington State with this promise of no income tax, of a business-friendly environment. Washington State's business-friendly climate drops. If you're not using voice to text, you got to get on this.
12:00 ↗So look at this. Washington State's business climate has faced mounting pressure We have dropped to forty seventh in the nation. Now, I only went to high school, you know, over there in Arlington, just, you know, the one horse town, the two cows. But forty seventh out of fifty seems bad, right? I don't know. That math seems kind of bad. It's bad when Gregoire and Locke start coming out and saying, hey, boys and girls, stop spending.
12:38 ↗You got to stop attacking small business. But it's showing up already in the data. And this is showing up here in real estate. That's what I'm trying to tell you. This is not a continuable thing. All right, let's go through the chat real quick. Then I'm going to dig into a little bit of this data. Unfortunately, the U.S. is going lower in value.
13:03 ↗Yes and no. There are places in the U.S. that you can go in and you can look. And you can see. Ah, there we go. There we go. where you can see metros that are actually doing quite well. So let me show you. I'm gonna throw that data up on the screen. Boom. So this is Redfin Data Center. You can go through and look at this.
13:34 ↗This is what I look at real quick when I wanna look at national stuff. Year over year price changes. Look at that. San Francisco, sixteen percent. Milwaukee, nine point three. Philadelphia, a St. Louis, seven Cleveland, six right on down the line. So there are places that are, you know, doing bad, but there are places that are doing totally fine. And what's interesting too is you go, why is San Francisco doing so well and Seattle isn't?
14:09 ↗That should be the question you should be asking yourself. We should be outperforming San Francisco. I like it more here. Everyone likes it more here. But San Francisco is kicking our butt right now. Like, come on, people. We bought our home in Marysville in twenty twenty two point eight five. Had two children. Love to move to a larger home, but it's impossible losing our interest rate, losing the value.
14:35 ↗You know what, Michael? I agree with you. Unfortunately, what we call you is we call you an interest rate hostage. It's the lock in effect. It's when prices were really low. And what I'm going to do is I'll pull up Snohomish County in the background just to look at the county as a whole. And when prices were really low, you know, the market was starting to slow down right
15:00–20:00 Read transcript
15:01 ↗here, right before COVID in eighteen as the Fed was hiking. Then magically we had this thing that was going to kill us and magically the Federal Reserve had to massively lower rates. And so prices shot up. But look, since twenty twenty two, they've been moving sideways. The problem is, though, is during that same time period, mortgage rates like you just said. mortgage rates went from three percent.
15:30 ↗So today, let's go to Mortgage News Daily. Mortgage News Daily. Whoops. Mortgage News Daily. Boom. Oh, my goodness. Today, that's seven point five eight. I mean, that's literally a doubling, Michael. And you're not the only one. So you're an interest rate hostage. You're an equity hostage. we can't afford to move to the next one and the federal reserve right now is talking about hiking rates even more it's just crazy where we're at right now okay what else we got uh everyone thomas i see your comment there are people making money people making money So, let's look at Fred.
16:30 ↗Federal Reserve, third-year fixed debt. Okay, the Federal Reserve, third-year fixed. I mean, look how low it got right there in in twenty twenty. That's where you got that mortgage and then boom, it shot up. It caused united states to go from like six and a half million in sales to about four million you then also saw and i'm still in snohomish county but let's go over here to close sales you saw closed sales in snohomish county for conversation's sake at eighteen hundred in june of twenty one and then last month there in august there was eight hundred and thirty six a thousand units less Let's go to June of this year to make the exact comparison.
17:25 ↗There would be eight hundred units less in this June. I mean, look at that overhead space that's just massively missing what's happening. And I don't know if Trump cares or Trump doesn't care. I see the comment. I think whether this was Trump, Biden, Republican, Democrat, it doesn't really matter. When inflation is high, And the consumer is feeling pinched. The consumer will do everything possible to get that party out of office and replace them.
18:04 ↗That's just a reality. Consumers vote with their pocketbooks. And inflation is being driven right now mainly by oil prices. I mean, look how much diesel is. Diesel is outrageous oil. right now. Almost eight bucks a gallon. So back to good old tech. Tech here in the Seattle metro. Tech in Seattle. And when we're talking about tech in Seattle, realize that tech buyer, they're making good wages.
18:45 ↗so when you remove that tech buyer that was making a hundred and fifty grand two hundred grand three hundred grand all of a sudden these properties where the median price is over a million dollars they don't make as much sense anymore and what what you're seeing is that show up. So I believe what's happening is there is a higher concentration of H one B one visas in Bothell.
19:22 ↗And so I went and did the research on that because I was like, you know, maybe there is. Uh, so I'm trying to look up the numbers due to do the department of LCA data for Bothell. shows a visible concentration of sponsored tech employment. And it's from Microsoft, T-Mobile, AT&T, HCL, Adventure, Cognizant, Salesforce, Meta, and others. The median wage is at one hundred and forty five thousand.
19:59 ↗But when we started saying, hey,
20:00–25:00 Read transcript
20:03 ↗we may not renew H-B-B visas, when we started deporting people, all of a sudden Bothell started getting these numbers that, I mean, quite honestly, just blow my mind. So I'm going to pull it up in the background. It is the nine nine eight zero two one. holy tolito holy tolito carlito wow this blows my mind okay so i'm going to show you five years in bothell when you look at the five years in bothell massive shoot up in price okay now we're looking at median median is the middle so it's less affected by the highs and the lows but still definitely affected And the average is add them all together, divide by the total.
20:57 ↗So we like to look at the median because it seems to be impacted by the highs and the lows the least. What you can see in the data was the median price in January, twenty twenty five was one point four million dollars. Last month, let me make this big so it's easier for you to see it. One point one two five. Holy shnikes.
21:25 ↗You guys remember Scooby-Doo? Shnikes! One point four to one point one to... that is two hundred and seventy five thousand dollars in difference that is just wild now i just uh i was showing you the data not smoothed now this is the data smooth aka over a rolling twelve you'll see the peak is one point two one five in october down to nine hundred and ninety five thousand This August and September's data will be done here real soon.
22:06 ↗It's down. We got a zip code in, in Bellevue, literally showing the same thing. Just wild. If you guys want to know, you know, specific data, let me know in the comments, I'm going to drop in our data and research for this. But once again, I was going in with the hypothesis of like, is tech is tech. Like genuinely causing the housing market to slow down.
22:33 ↗And I'm going to throw this up and I got to share this because this one's a JPEG. Share screen. Window. There it is. Share. Oh, perfect. Make me small. I will put this data into a link in the chat so you can see it. There is absolutely a direct correlation in tech and the secondary tech market. You can see that in the core tech market, that it is basically down six percent versus just regular King County is only down three and a half.
23:22 ↗the secondary tech markets down about five point nine percent aka six well regular king county down three and a half snowmage county is basically the same too and so when our listeners our subscribers the people that hang out with us in the community go hey what's happening with tech is this affecting real estate this was a great thing to dig into it's super clear in the data also what's funny I opened up chat GPT, opened up Claude, and I put in this hypothesis and I said, go grab this data.
23:56 ↗And I grabbed it a bunch of data, I upload it. And immediately the stupid nannies, anyone else get the AI nannies? The AI stupid nannies start telling me, oh, you can't think of this as correlation. It's not correlated. I was like, then run the statistical math. And then it's like, oh yeah, by the way, this is definitely correlated. No she's. Like, no she's, Batman.
24:22 ↗That's S-H-I-T, just me bleeping it out for you. Because you knew it, you felt it, you could see it on the ground. But the model is weird about, you know, they're trying to keep their political bias in there. They're trying to keep you from saying something when inside the data there's a clear correlation here. Pretty amazing. All right. What do we got for more questions?
24:51 ↗More comments. My wife runs a small resale business. When the tariff hits, she had to pay more, but now the giant companies got reimbursed and small businesses did not.
25:00–30:00 Read transcript
25:00 ↗Tough for the little guy. If, and this is just my understanding, not financial advice, not legal advice, but my understanding is that any business can go get the tariffs back that are owed to them. And what I would do there is here. Hold on. I got to remove this one. Stop sharing that screen. Share screen. Window. Oh, come on. There we go.
25:34 ↗What I would do there is I would open my favorite model. Something like ChatGPT. And what I would do is I would go into work and I'd go to, and I'd go roll Astra and roll Astra on high and give it computer use. And you could try this in cloud code too. And I would say, I'm a small business. I want to get my tariff money back.
26:04 ↗How do I do that? Walk me through the steps. Tell me the documentation that you need. Give it the documentation and have it send off the letters for you. Propose the emails, write the documentation, and definitely go fight to get your money. The problem is these big corporations, they got millions that they can spend on things like this. They've got attorneys. They got staff members.
26:26 ↗They have admin. I operate a small business. We operate multiple small businesses here in real estate. So I feel for you. And a lot of things come down to, you know, me, the business owner at the end of the day. Yes, we have staff. My father-in-law told me a story when I was a kid. Oh, there goes my pen. He said, if you are not willing, and he was a small business owner too.
26:52 ↗If you're not willing to be the janitor, the cook, the bookkeeper, he owned a restaurant, the host, the dishwasher, and the manager and the owner all at the same time, then don't go into business. And part of being that small business owner, which is so hard, is you have to do all of these things. So once again, I'd recommend having one of these models help you with it, and they could totally help you do that.
27:21 ↗My house has doubled in value since I bought it. Not sure what some of you are talking about. absolutely there's quite a few homes that have doubled in value you know so once again let's just go look let's go look at uh snohomish county this time and this is once again we're looking at the smoothed out data right here the rolling twelve and if you go back Man, if anyone bought, look at that, two thousand seven, the peak was approximately three hundred forty two thousand.
27:56 ↗The bottom in Snohomish County is approximately two twenty and two thousand twelve. But let's say you bought in nineteen. I mean, that's four fifty to seven fifty right there. That's basically a doubling. And it's like that all over Snohomish County, King County, Pierce County, Thurston County. All depends on when you bought it. But when the Fed hiked up rates, when you go into these tighter timeframes and we're looking over the last five years, you can see it basically, they hiked here in twenty twenty two.
28:30 ↗The market essentially moves sideways and slightly down since then. That's what what some of these people are experiencing right now is they're thinking about selling. And if you basically bought since twenty twenty two. It is hard for you to make a profit. What do you think about the National Flood IP flood insurance situation? I don't remember. You know what? Me and Google are going to play in the background.
29:02 ↗NFIP, because I don't remember what that stands for. National Flood Insurance Program. I think, well, a couple things. I grew up in Snohomish County. So I watched the Stillagvamish River flood as a kid. I remember my mom driving her, she had a Beretta. Okay. Anyone else remember a Chevy Beretta? She has a little two-door coupe and it was maroon. And we were going to drive through the river.
29:36 ↗And she's like, I'm just going to drive through it. And it's over the road. And I was like, mom, mom, you're scaring the crap out of me. and we went through and a little bit of water came in the car kind of scooted a little bit but she just kept going it's kind of who my mom uh is she's a fiercely independent finnish woman like a hundred percent finn finns are very independent when you come from
30:00–35:00 Read transcript
30:03 ↗like the great north where everything is frozen you learn to just be like super independent the moral of the story is this since my childhood it seems as though flooding in our area has gotten worse and then we're seeing more flood insurance claims so these flood programs the insurance rates are going up also they've had more collections not just here in washington state but nationally against natural disasters so you're going to see more of these types of things pop up in the future.
30:39 ↗And it's just going to be more expensive. So properties that are riverfront, creekfront, that are in the floodplain, their insurance is going to just continue to cost even more and more. That's kind of what I think about it. If you have more questions, Sam, I think that's your name, Sam's GoPro... GoPro video footage, nine, one, nine, zero. I love me my GoPro.
31:12 ↗They were so good at marketing. Like everyone had to have one. But if you have more questions about that, drop it below because that's how we started this whole conversation about tech. We started this conversation because you, our listeners, our subscribers were like, what's happening with tech and with real estate? Let me show you that Bellevue zip code that's also super beat up.
31:36 ↗It is the nine eight zero zero seven. OK. So the nine eight zero zero seven, what's happened is it's peaked and it's pulled back. This definitely doesn't look as bad as Bothell. Why? OK, now it is down, but the price was higher to start with. Bothell doesn't have as much money. Bothell is a secondary market. Bothell is further from the jobs. Now, it's not just Bothell.
32:07 ↗In the data in the link below, I'll give you a copy of all the cities. and what's happening and when you go to the website if you go to look at it hey it's only eighty percent sasha on whatsapp is helping me fix it and get it all the way done team's working on getting it all the way done but we just wanted to get it launched and get it get it actually up and working yes sam is the name let's go sam scotty to hottie I like your name.
32:40 ↗Reminds me when the government bailed out the banks years ago, but left small business high and dry. Oh, don't even get me started. Okay. So during the great financial crisis, I worked for banks. We did a bunch of REOs. We did bank-owned properties. We did short sales. We did estates. We did foreclosures. We did it all. And One, I was happy to have work because I was doing a bunch of new construction before then the great financial crisis happened.
33:13 ↗It took all of that new construction away from me. But, two, two thousand eight bank bailout. Look at this. The Emergency Economic Stabilization Act of two thousand eight was seven hundred billion. federal law and we brought through tarp this was the first time in american history where we we basically privatized the profits and publicized the losses now there's two parts to this though i don't like i don't love the bank bailouts Because I was working for a bunch of them, if we didn't bail some of them out, I think our whole economy was just going to go into not just the great financial crisis.
34:08 ↗We were probably going into depression number two because it was bad. If you look at the home prices during that time period. So let's go into King County real quick. And let's use average. So I mean, it gets really wild on us. We're going to max this bad boy out. So look at this. July of two thousand seven. The average price in King County was five hundred and twenty eight thousand.
34:39 ↗It then dropped to three fifty two. OK, well, the median went from four twenty eight to two seventy. So let's. Let's play with the model for a for a second. If a price drops from five, to hold on, what was that number again?
35:00–40:00 Read transcript
35:05 ↗Got too many things going on a DD taken over Oh, to three over five years. what is the rate of decline and this is in the hundred thousand range in king county how much did prices drop let's just have it do the math for us real quick the problem is prices were dropping so rapidly and no one had equity and no one had savings and unemployment was massively rising and the foreclosure rate was massively rising there was so much inventory Let me show you King County months of supply.
35:54 ↗There we go. So right now, you're at basically four point nine months, which means if no new homes came on the market in four point nine months, you'd be completely out. This is really the start of a of a buyer's market. The old school way of looking at it was to say below six months is a seller's market above six months is a buyer's market.
36:18 ↗I would argue, though, because the industry got moving so faster in COVID, I would say above three point eight months is the start of a buyer's market. Now, we don't have to get into the real buyer's market, but we're at four point nine. I mean, we peaked at eleven point four in two thousand nine. That's almost a year's worth of inventory. At one point, ladies and gentlemen, I had one hundred and forty four active listings and I had two hundred more short sales and foreclosures coming down the pipe behind it.
36:54 ↗On average right now, we carry, you know, somewhere around twenty. Okay, so you can see how many multiples of times bigger that was. So the annual rate of decline during that time was seven point eight percent per year and thirty three percent. That is massive. And there were places inside the market where you saw forty percent drops and fifty percent drops because I just showed you the whole market.
37:24 ↗Are there maybe outlying areas or pockets in that that got worse during that time frame? Absolutely. So, Scotty Tuhati, that was my ADD going off the deep end about TARP and banks getting bailed out. But they kind of had to because this number was going to get out of control if they didn't. um i'm in tech and i was on the market for two million plus we've had two mass layoffs this year my entire team in seattle got decimated i survive but i'm no longer looking for a bigger house One, I'm very sorry to hear that.
38:08 ↗Two, good job. And what I mean by good job is you survived. One thing I do think that also tech is going through is, you know, looking at that third year fixed debt, when everything was really cheap, you know, right here, tech also started massively hiring and over hiring during that process. So they over blew up their balance sheets with people. And now part of what's happening is, yeah, they want to blame AI because it sounds sexy, because it's a boogeyman.
38:44 ↗But I actually think when debt was really cheap, they were just overhiring too. And that overhiring is now some of that is being trimmed away. But some of these cuts are just absolutely painful. Some of my other friends that are in tech have been sharing similar stories with me. about how they're having to work harder and longer to justify and that there are massive demands being put on them.
39:18 ↗Anton, if I'm paying thirty one, forty one in rent and we want to buy, but this market is fluctuating like it is, we've never bought a home before. Should we see what we qualify for in your experience? SK Ryan. Skyron? It's always hard to tell. So let's go with SK Ryan. SK Ryan, I absolutely would. So one, you always have to understand, I'm a real estate guy.
39:50 ↗It's where the majority of my holdings are. It's what we buy and invest in. It's what we sell every day. So you're asking the guy whose product, should you go buy it? Well, the answer to me is yes,
40:00–45:00 Read transcript
40:00 ↗of course. But let me caveat this. let me show a couple reasons so in let me throw some data up here we're gonna look at the um closed sales no let's not look at closed sales what should we be looking at let's look at sales prices that'll work so when the market peaked in So King County is literally July. What's funny is Snohomish County is June.
40:37 ↗So when King County peaked in July, it trended down until basically February of, all right, let's do some simple Arlington math together. Seven, eight, nine, ten, eleven, twelve, five. Cool, we're on the same page. So it went down for approximately five years. Well, what we saw was we saw the market peak in twenty twenty two and then just kind of move sideways.
41:05 ↗Let's do the same math. Twenty three, twenty four, twenty five, twenty six, twenty seven, five. Could we be nearing the end of a real estate cycle? Probably. Do I have a crystal ball? No. Are my buyers getting smoking deals right now? Oh, yeah. One of the young men on our team, his name is Sawyer. He's literally like through four walls that way.
41:38 ↗He is in his twenties. He just got engaged. And in a market that's really hard, his income is going up right now. Why? Because he's showing up every day and putting in the hard work and doing what's necessary, performing at a way above average level. Yesterday, him and his fiance closed on their first home. This is my heart of coal warming up a little bit because of that.
42:09 ↗Why would a young man in the industry buy a home today? Well, he was able to get, remember he's a real estate broker. So he got paid to buy the house. He got his interest rate bought down. He got all the contingencies that he wanted. He got the house below market and he got all of his closing costs paid. So the very first step, whether you're thinking about today or sometime, even the next five years, Chat with an amazing lender.
42:39 ↗If you need one, SK Ryan, we can totally get one over to you. But you chat with an amazing lender. You'd put the numbers together with that lender and you figure out, all right, maybe there's a couple things I need to fix on my credit. Maybe there's not. Maybe I need to save up more money. But you figure out how to properly position yourself in the market to maximize the balance of your wants needs, and the price.
43:08 ↗It's a weird little Venn diagram of want, need, and price where price outweighs want and need because price turns into the monthly payment. Another interesting thing that a lot of people forget when they are purchasing a home is all of a sudden now you also get a big write-off because the government only likes two people. P.S., if you didn't know this, I'm dropping dimes right now.
43:36 ↗The government likes two people. Who do you think those two people are? Well, I'm going to tell you. They are business owners and homeowners. That is the only segments of the population they give any tax breaks to. Everyone else doesn't really get any. What they say is they say, hey, you get to write off all of the interest. You get right off the interest and the taxes.
44:02 ↗So every year you get a nice little write-off. SK Ryan, if there's something we can do to help, hit us up at rsg.com or askanton.com. Both of those websites, we are happy to help. Once again, no pressure. But it looks like if this cycle is repeating itself, we're probably near the end. Because I want you to ask yourself this. If you open up TradingView, P.S.
44:27 ↗I also like the stock market. That's why I got my little TradingView open. You come over here, you go to Brent, aka Brent Crude. So Brent, you know, this is pre-Iran, you know, in the sixties. Oh no. Technical term. Oh no. Shoots up to one fifteen. You know, we're getting a peace deal. We're not getting a peace deal. Not getting a peace deal.
44:55 ↗Boom. But we're sitting right here. As soon as this goes down,
45:00–50:00 Read transcript
45:02 ↗The ten-year treasury, that's not the ten-year treasury. Where'd it go? The ten-year treasury will go down. The ten-year treasury heading into the beginning of this year, right there, look at that, three point nine six. When it was three point nine six, thirty-year fixed debt was under six percent. The market was lighting on freaking fire. to start this year. And I was like, twenty twenty six is going to be better than twenty five.
45:33 ↗Let's go kill it. But The Iran war was not on my bingo card. So then, boom, it happens. The tenure shoots up. You can take this number and essentially add two percent to it or two hundred basis points. That's basically third year fixed debt with thirty with his being so high right now. It causes buyer activity to slow down. Buyer activity slows down when interest rates are above six and a half.
46:04 ↗and it picks up below six and a half. This is so clear in the data. So once rates come down, the market will just go right back to picking up because fundamentally we're behind on housing. We're about a quarter million units behind. I go get building permits. I do land development projects. I can tell you they are miserable. They are brain damage.
46:30 ↗I'm just a glutton for punishment. And so we keep doing them. But what's happening is there's not enough supply coming in the future. When you look at the info sparks and you look at the closed sales, look how low the closed sales are there in King County. When this gap starts to come back, watch out. Price is going up, ladies and gentlemen.
47:00 ↗Yes, absolutely. Start the ball rolling to see what you qualify for. Eight hundred credit score. You're gangster. That's awesome. What we'll do is we've done other episodes with my friend Cody Touche. I will also drop Cody's contact information in there. Let me show you his episode. Cody did a phenomenal job talking about this. And videos. Look, there we're live. Meet Kevin. He did good.
47:34 ↗Right here two weeks ago, this episode with Cody. You can give Cody Touche a call. He's going to do an awesome job to be able to help you out. He's done tons and tons of loans for us. Is it still a buyer's market? Oh, yeah, it's a buyer's market. Trivia Loan Eleven. It is absolutely a buyer's market. You can see that in the data in the months of supply of pending.
48:00 ↗Let me show it to you real quick. Look at that rise. All you got to do is look at oil. Oh, wait a second. Does the oil and the supply graph look similar? Hmm. Are they rising together because the rise in oil is inflationary and it causes interest rates to go up? See, look, trending up right there. Yes. So what I think is going to happen, Anton has no crystal ball.
48:37 ↗But Anton has looked at this freaking data since two thousand three. I went to school to be a biochemist. I got into real estate. I just thought it was the thing you're supposed to do. We're supposed to do the nerdy stuff and look at all the data. And when you look at this data, you start to see those patterns. And yes, I do think that it's so is it going to be a buyer's market in twenty twenty seven?
49:02 ↗If the conflict with Iran is still going on and rates stay higher and the Fed hikes, then yes, absolutely it will. If we get a settlement and rates come down, then no, it won't. But the next question is like, well, when is the best time to buy? Let's look at the data. The data shows us the best time to buy. So we can go look at what's called the percent of original list price.
49:26 ↗See, there's too much data. There we go. So this is just the last three years. The lower the number, the better here. The lower the number, the better. What this means is if we look at the peak this year, March of twenty twenty six in King County was ninety eight point nine percent. What that means is it means the average buyer got one point one percent off of the list price.
49:55 ↗OK, well, you want to go when the when the data shows you can get the most.
50:00–55:00 Read transcript
50:00 ↗Oh, look at that. That's December, December, January, December, January. So last December and January, ninety five point five and ninety five point six. In other words, the average buyer got almost five percent off the purchase price. Last month, the average buyer got three point eight percent off the purchase price. So what I tell you is, do you want to wait all the way till spring?
50:26 ↗When everyone's going to hop in and this graph is going to trend in an upward direction and you're going to have to pay more for a home, if your goal is to buy one in the next six months, I would do it now. Because look, every spring market, see how it goes up. The historical average is about ninety eight point six. So see how like right here in twenty four, that's one hundred and two.
50:49 ↗That's bidding wars. Let me go back five years so you can see this. Look at that. That's twenty twenty two right before the Fed raises rates. That's one hundred and eleven point four. That's massive bidding wars. This is when the people were giving away the Tesla's and the fifty thousand dollar nonrefundable earnest monies and waiving everything. This right here is more normal.
51:09 ↗Let me show you on a on a bigger time frame. This band, you know, kind of in that hundred and ninety five, that's more normal. When we get above that, that's bidding wars. Okay, so this year, great. All right, what's the question next? Sam's GoPro. How often does access to backup water supply like wells, pools, and springs come up with buyers of yours?
51:35 ↗Am I just a water nerd? Sam, you are a water nerd, sir, and you should be, and I freaking love it. One of my friends is building out in the San Juans. There is a natural pond on the property. The natural pond is set as just in case of fire. I do believe, okay? So you remember when they were talking about this idea that data is the new oil, right?
52:10 ↗They're talking about this idea, data is the new oil. Back in the early two thousands, late two thousands, I think water is more valuable than oil. And if you look at this, just to give you an example, how much do you pay for a bottle of water? A lot of money. Cheapest you get them is like sixty cents to a dollar. At the airport, you pay like five bucks.
52:40 ↗That's like five bucks for sixteen ounces. That's insanity. Also, I think that we have to increase our water cleaning abilities. We need better technology there. In Washington State, you can look up what's called the Hearst decision. Hearst decision. In fact, it's spelled decision. Decision. decision water oh that's because I spelt it wrong so Sam this is something you should check out the Hearst decision in required counties to independently verify new permit exempt well water.
53:33 ↗And what this did was this caused a lot of issues in the Skagit Valley Basin. in the Skagit Valley Basin because of all the water that's up there and you weren't allowed to drill wells and that even came up into Snohomish County. I think there's going to be more of that in the future. So no, I don't, one, yes, we don't get a lot of it, but two, I think you're gonna hear more and more of it in the future.
54:06 ↗Three, we've even done things like rain catchment systems and other cool things like that. All right, ladies and gentlemen, we we let the squirrels the add take over and the comments take over i wanted to see what oh a couple more points on ai ai is part of this massive inflation problem we're having right now we're having it because of tariffs we're having it because of oil but this cap x build out is so big that it's literally like just robbing everything let me give you an example i'm just going to reach over here This is.
54:47 ↗Sixteen gigs of memory. And I bought. Sixty four to replace. The sixteen. That's sixty four. Cost. After a lot of searching.
55:00–60:00 Read transcript
55:00 ↗Using an AI bot to find me the best. And the cheapest. Cost me five hundred and twenty four dollars. A few years ago. That literally would have only cost me. Like a hundred and twenty bucks. Why? Because it is. There's so much demand. Look at like the the fifty ninety GPU. You can't even pick them up for video gamers and they're forty five hundred dollars.
55:24 ↗I mean, some of them on a resale are like six to seven grand. So this AI cap X build out is creating a lot of jobs and being inflationary. One of our amazing people that works here, their significant other is at SpaceX right now. And they were pulled out of Washington State to go help with Colossus with the next level of build-out.
55:51 ↗That's wild that they would fly people from here to there to work. So I think... AI is currently inflationary. I think AI will continue to expand the job market. I think there's going to be a point though, there's a dip in there somewhere where there's a skill mismatch to the job. Jobs will go down for a little bit, then they'll go up because I believe in the human ingenuity.
56:19 ↗And I believe that's going to create a lot of opportunities for us in the future. Isn't memory the same cost regardless of what state you're in? The cost of of living in washington does nothing yeah i know digital phoenix i agree with you so the cost of living in washington state cost of living washington state oh that's what i'm looking for holy toledo okay let me show you this fourth most expensive in the nation gas prices rent unfortunately what we're seeing there digital phoenix is we're seeing ideology come head to head with economic realities and we've got to fight and push back against that you got to say no to initiative the income tax on everyone You've got to call your local politicians and say they've got to build more houses.
57:18 ↗Otherwise, rents get too high. Housing is too high. And we don't need apartments, freaking townhomes. I want single-family homes, little fences, little backyards so they make the babies. Otherwise, we're losing them all to affordable places like Tennessee. Skagit County wasn't affected by HRSA. They were already limited by the tribal decision. Oh. Dan, you are ahead of me, sir. I did not know that as much.
57:49 ↗Now that you're saying it, though, that makes sense because my friend's development project off of three hundredths got stopped because of that. I assumed they were all tied together. I didn't realize that they were separate issues. But maybe what happened was the Hearst decision just over-exasperated or accelerated that. Thoughts on rural, farm, homestead development? Yes. Ooh. JH, my man. Okay, so one, we did that AI episode about...
58:29 ↗Where did it go? We did this AI episode about... Quincy. This one right here. And my family's from Quincy. Farmers. And about how AI is changing what's happening right there and how they're condemning a bunch of property to bring in massive amounts of power. But to go back to your question, the Puget Sound Regional Council here controls the major counties. And the PSRC controls Thurston, Pierce, King, Snohomish, Skagit, and Wadcombe, if I remember correctly.
59:18 ↗And they voted not to expand the urban growth area. And they said in the rural area, we want to take development from six percent to two percent. So if you got development and it goes from six percent to two percent, aka down by two thirds, do you think the value of that's going to go up in the future? Yes or yes? Can I get an amen from the background, please, ladies and gentlemen?
59:50 ↗So yes, if you want to put together a rural homestead, a farm, a property on acreage, any property on acreage for this matter,
60:00–61:31 Read transcript
60:00 ↗if the stupid government gets its way and they take that rural development down, all of the values go up. It's personally one of my current investment strategies I am working on right now. So I am spending my own capital on this today. So I agree with you. uh all right thank you for notifying us things are oh you know what i'm always happy to share what i'm seeing here in washington state what we're seeing in the data you are listeners our subscribers the people that hang out with me you make this possible every time you comment every time you share a video every time you hype a video or interact with us it allows us just to spread this even further i'm just a guy who grew up in Arlington, who lives in Snohomish County, who operates a bunch of small business in real estate, real estate investment, new construction, land development.
60:57 ↗And I just like sharing the data and my thoughts as to what's happening. Because when someone said, is tech really affecting the market? I was like, I believe it is, but I think we need to go get the data to prove this. And we did. And so thank you for hanging out with me on another live stream. I will drop this in the link below so you can see access to that data.
61:19 ↗It will take us a few minutes to do that, so it's not going to immediately be there. But if you have any questions or comments, hit us up. If we can help you in real estate, hit us up at resg.com and have an amazing day. Laters, people.
13 / Follow the evidence
Sources, dates and what each one measures.
- NWMLS FastStats / ShowingTime Plus — Local Market Updates, August 2026. Primary housing source. Original reports carry Northwest Multiple Listing Service data and © 2026 ShowingTime Plus, LLC. AskAnton charts are derived from the supplied aggregate statistics. Download the complete public data extraction (CSV); no broker login or signup is required. This is an extraction of the report tables, not the original PDFs.
- Redfin — San Francisco’s Housing Market Booms While Seattle Slumps, September 2, 2026. Regional context, primarily July comparisons. Geography and definitions differ from the NWMLS ZIP reports.
- Washington Employment Security Department — WARN database. Primary source for employer notices, locations, affected-worker counts and effective dates. Notices are not a complete count of all job losses.
- Axios Seattle — The relentless drip of Seattle’s tech layoffs, September 21, 2026. Dated secondary synthesis of filings and announcements; the employer counts above are attributed to this report.
- GeekWire — Seattle tech job postings remain far below pre-pandemic levels, December 9, 2025. Secondary reporting of Indeed’s November 27, 2025 occupation indexes. Historical context only.
- Indeed Hiring Lab — 2026 US Jobs & Hiring Trends Report, November 20, 2025. Primary hiring research and outlook. Job postings measure advertised hiring demand, not the number of people employed.
- Zillow Research — Housing Data and ZHVI definitions. Methodological context for estimated typical home values and why source comparisons can differ.
- Anton Stetner — Seattle’s Tech Layoffs Are Starting to Break the Housing Market, September 29, 2026. Original video and the editorial discussion behind this guide; full owner-supplied caption transcript in this guide.
- Consumer Financial Protection Bureau — Monthly payment components. Principal, interest, taxes, insurance and other ownership costs. See also its mortgage-cost guidance for upfront-versus-monthly tradeoffs.
- IRS Publication 936 — Home Mortgage Interest Deduction. Eligibility, itemizing and limits; a tax benefit is not assumed in the calculator.
- Washington Commerce — 2023 housing-needs projection through 2044. Statewide long-term need, distinct from current available inventory.
- Freddie Mac — June 2019 research on the mortgage–Treasury spread. Explains why the relationship is not a fixed two-percentage-point rule; not a current rate quote.
Prepared as an educational market analysis. Figures are a dated snapshot and may later be revised. A property-specific decision needs current comparable listings, transaction terms and professional advice appropriate to the situation.
14 / Frequently asked questions
Seattle tech layoffs and housing: your questions, answered.
Are Seattle tech layoffs causing home prices to fall?
The NWMLS analysis finds weaker year-to-date price performance in the selected tech-corridor ZIPs. That is consistent with an employment and confidence shock, but the data do not identify buyers’ employers or isolate layoffs from mortgage rates, new supply, location and the mix of homes sold. The evidence supports an association, not a precise causal estimate.
Is the Seattle housing market crashing in 2026?
The supplied August 2026 reports show a correction with very different outcomes by ZIP and property type. King County’s residential YTD median was down 3.5%, while Bellevue 98007 and Bothell 98021 were down 13.2% and 13.0%. These figures do not establish a uniform regional crash or predict what any individual home will sell for.
Did Bellevue home prices drop 13.2%?
The 13.2% decline is the residential median for ZIP 98007, comparing January–August 2026 with January–August 2025. It is not a citywide Bellevue figure. The five-ZIP Bellevue proxy in this analysis fell about 6.0%, and that proxy is a weighted average of ZIP medians, not an official municipal median.
What was the biggest Bothell price decline?
Among the three Bothell residential ZIPs, 98021 had the largest YTD decline: $1,324,000 to $1,152,500, or 13.0%. ZIP 98011 was down 9.0% and 98012 was down 7.0%. The three-ZIP postal-market proxy fell about 9.3%. Condos are a separate category and can show different, more volatile results.
Why does Redmond look different from Bellevue and Bothell?
Redmond’s two-ZIP residential proxy fell about 3.3% YTD, and ZIP 98052 fell 4.3%. Different inventory, price tiers and sales mix can produce different results even among markets near major employers. This report does not measure enough household or employment detail to assign those differences to wealth or commute distance alone.
What does year to date mean in the NWMLS charts?
It compares the median of sales closed from January through August 2026 with the median of sales closed from January through August 2025. It does not measure the change from January 2026 to August 2026. August year over year compares August 2026 alone with August 2025 alone.
Are home-price declines accelerating across the tech corridor?
The August snapshot does not establish that. The core-tech group averaged a 6.6% YTD decline and a 5.5% August decline; secondary-tech ZIPs averaged a 5.9% YTD decline and a 4.8% August decline. Kirkland and several other postal markets had weaker August comparisons, but a proper acceleration test requires a monthly time series with seasonality and sales mix addressed.
Why do NWMLS, Redfin and Zillow give different numbers?
They can measure different geographies, property types and periods. NWMLS FastStats reports transaction statistics, while Zillow’s ZHVI estimates typical home values. A transaction median can shift when a different mix of homes sells. Match definitions before comparing sources; this guide prioritizes the supplied NWMLS reports for local transaction facts.
Do these numbers include condos?
The main tech-corridor charts use the reports’ Residential category. The complete data explorer includes separate Residential and Condo records for all 108 reports. King County’s condo YTD median fell 7.8%, versus 3.5% for residential. Do not apply one category’s trend to the other.
Is this a good time to buy a home in Seattle or the Eastside?
It depends on the property, your reliable income, cash reserves and expected holding period. More choices and longer marketing times can help negotiations, but a lower price does not automatically mean an affordable payment. Compare nearby competing homes, inspect carefully and ask your lender to assess the actual financing terms.
How much below asking price should a buyer offer?
A ZIP-level median decline is not an offer-discount formula. Review recent comparable sales, competing active listings, price reductions, condition and the seller’s timeline. A well-priced home can still attract competition in a soft market. Build an offer around that property’s evidence and the full contract terms.
Should sellers cut their asking price immediately?
First compare the home with current competition and recent pending and closed sales. If qualified showings and offers are missing, investigate price, presentation, access and condition together. Agree on a review date and a meaningful adjustment plan. A county statistic alone is not enough to set the asking price.
Will builder incentives protect resale prices?
Builder incentives can make a competing new home more affordable without changing its headline price. Compare price, closing costs, rate terms, fees, inspection rights and completion conditions. The supplied FastStats price figures do not account for concessions or downpayment assistance, so they cannot measure the full economic discount.
Do layoffs or visa uncertainty mean a homeowner must sell?
No. These aggregate reports contain no information about any homeowner’s employer, immigration status, finances or reason for selling. Employment uncertainty may affect household planning, but a ZIP code does not establish an individual’s circumstances or negotiating position.
Is there a Snohomish County total in this report collection?
No. The supplied collection contains one King County report, 81 King County ZIP reports and 26 Snohomish County ZIP reports. It does not contain a Snohomish County aggregate. Averaging ZIP medians would not reconstruct an official county median.
Where can I get the data without a broker login?
Use this page’s complete-data CSV for all 216 residential and condo records, plus its charts and methodology download. No broker login or signup is needed. The original August 2026 NWMLS FastStats reports supplied by Anton are the underlying source; the downloadable CSV is AskAnton’s extraction, not the original PDFs.
Can a housing shortage exist while listings rise and prices fall?
Yes. Long-term housing need and the number of buyers able and willing to purchase today are different measures. A region can need more housing over many years while high payments or job uncertainty reduce current demand. That can leave more homes competing for fewer active buyers in a particular segment.
Should I get preapproved if I am not ready to buy yet?
A lender conversation can help you understand payment, cash-to-close and credit requirements before deciding whether to buy. Ask what the review involves, including any credit inquiry, and compare written estimates when you have a real purchase scenario. A lender’s maximum approval is not the same as your comfortable household budget.
Does buying a home automatically give me a tax break?
No. Mortgage-interest deductions depend on eligibility, itemizing and applicable limits. The guide links to IRS Publication 936. Do not subtract an assumed tax benefit from your monthly housing budget; have a tax professional evaluate your own situation.
Will 2027 definitely be a buyer’s market?
The livestream offers conditional scenarios, not a certainty. Persistent payment pressure and weak employment could preserve negotiating room. Lower borrowing costs could revive demand, but the result also depends on jobs and the homes available in the same segment. The August 2026 snapshot does not establish the next market bottom.