October market update: Charts show October 2026 NWMLS data. Redmond city history and mortgage-rate context are included. Eight price ranges and six property-feature comparisons are included. This dated report is not a live listing feed.
Redmond seller intelligence
Selling in Redmond?Know the market you’re actually in.
Your competition is the next home a buyer would choose. Compare your ZIP, property type, inventory and financing conditions to build a stronger selling plan. Buying here—or selling and buying? Use the same evidence to plan your next move.
No signup to read the research. Start a conversation when you’re ready.
NWMLS market data · October 2026Residential + condosPrepared by Ask Anton
Redmond city homes for sale221Residential · month-end snapshot
Accepted offers42Residential · October 2026
Completed sales44Residential · October 2026
This snapshot uses Redmond city in InfoSparks. ZIP comparisons below cover separate postal geographies and will not sum to these city totals.
01 / Start with the selling decision
A strong sale starts with the right comparison.
Redmond city · October 2026 versus October 2025 · NWMLS InfoSparks. Percentage changes below are calculated from exported values.
MORE COMPETITION
+82.6% residential inventory.
Redmond city had 221 residential listings at October month-end, versus 121 a year earlier. Closings fell from 63 to 44 (-30.2%). For a seller, a compelling launch price and presentation matter when buyers have more alternatives. For a buyer, those alternatives are worth comparing before making an offer.
DIFFERENT PRICE SIGNALS
Both medians fell; the sales mix matters.
The residential median was $1,383,500 (-10.7% year over year); the condo median was $575,500 (-39.1%). These medians reflect the mix of sales; they do not measure a gain or loss for the same home. Choose the right property type and bracket before interpreting the headline.
A MIXED PACE
Marketing time tells another story.
Residential median days to an accepted offer changed from 22 to 13, while the condo measure changed from 30 to 33. The median describes properties reaching an accepted offer, not the full waiting time of active listings. Use the property’s actual competition and the source’s longer history.
What the price bands reveal
Redmond has several markets moving at different speeds.
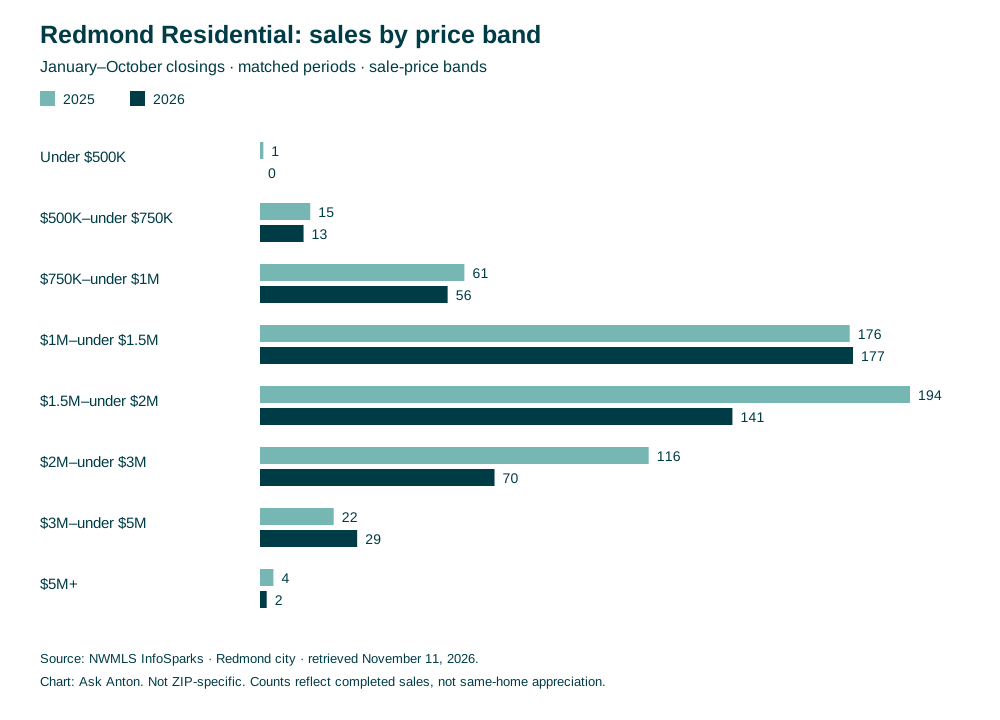
Redmond city · inventory: October 2025 → 2026; sales: January–October 2025 → 2026. City findings are not ZIP-specific results.
The Redmond headline can hide the market for your home.
A luxury residential property and a condo may share a ZIP code while facing very different competition. Begin with the right category, then narrow to your price range, condition, location and features.
Use this report to identify the questions that matter. A pricing recommendation should also examine current listings, pending sales and recent comparable closings. The historical snapshot below cannot establish what a particular home will sell for today.
01
Price for the next buyer.
Explain why your home is compelling at its asking price compared with the available alternatives. Treat yesterday’s peak or your renovation cost as context, not a buyer’s obligation.
02
Prepare with a budget.
Prioritize the issues buyers will notice and the information they will need. Compare the cost and delay of improvements with an as-is sale before committing.
03
Set a review date.
Agree in advance on when to review showings, feedback, new competitors and offers. Respond to evidence rather than waiting indefinitely at a price the market has not accepted.
Let’s talk about your next move
Get your Redmond market plan.
Pricing and preparation for sellers. Competition and payment questions for buyers. A coordinated plan if you’re doing both.
Your conversation
Ask in your own words.
Chat uses Functional cookies. Review to enable them.
Prefer a person? Email the team about your Redmond sale or purchase. Email info@askanton.com.
You’re chatting with our digital assistant. Responses can make mistakes. Chat sessions are recorded. Verify important information before acting. About using Ask Anton By sending a message, you agree to our Terms of Use, including arbitration and use of your submissions in content, and acknowledge our Privacy Policy.
The deep dive / Six differences that matter
Your competition depends on your price, property and timing.
Start with the segment buyers would compare with your home. These six findings explain why the city median is only the beginning of a selling or buying plan.
Redmond city · NWMLS InfoSparks · retrieved November 11, 2026. YTD means January–October in each year. Recent comparisons use August–October. Percentage changes are calculated from exported counts. Download the underlying segment data (CSV) ↓
01 / Residential price bands
Sales held near $1M–$1.5M. Competition nearly tripled.
The $1M–under $1.5M residential band recorded 177 YTD closings versus 176. August–October closings were also unchanged at 62 in each year. Yet October inventory increased from 24 to 70, and source months of supply rose from 1.4 to 4.1.
This is a more useful seller signal than simply calling the market slow: completed-sale activity held up over matched periods while available choices expanded. A home needs a clear reason to win the next buyer’s attention.
Residential · Redmond city. Closings: January–October. Inventory and source months of supply: October month-end. Every arrow compares 2025 → 2026.
Sale-price band*
YTD closings
Change
Inventory*
Months of supply*
Under $500K
1 → 0Small sample
-100.0%
1 → 3
1 → Not reported
$500K–under $750K
15 → 13
-13.3%
4 → 7
2.4 → 4.3
$750K–under $1M
61 → 56
-8.2%
9 → 25
1.6 → 4.6
$1M–under $1.5M
176 → 177
+0.6%
24 → 70
1.4 → 4.1
$1.5M–under $2M
194 → 141
-27.3%
38 → 56
2 → 3.9
$2M–under $3M
116 → 70
-39.7%
19 → 41
1.8 → 5.8
$3M–under $5M
22 → 29
+31.8%
24 → 14
8.5 → 4.1
$5M+
4 → 2Small sample
-50.0%
2 → 5
2 → 5
Residential: where sales are happeningJanuary–October closings · 2025 versus 2026
20252026
Under $500K
1
0
$500K–under $750K
15
13
$750K–under $1M
61
56
$1M–under $1.5M
176
177
$1.5M–under $2M
194
141
$2M–under $3M
116
70
$3M–under $5M
22
29
$5M+
4
2
Bars begin at zero. Each property-type chart has its own scale. Exact counts and changes are in the table above.
Seller read: Compare your price, condition, layout and preparation against the active alternatives. Set a review date for showings and feedback. Buyer read: Use the wider selection to compare fit and full cost; it does not establish a fixed discount on every property.
Below $1M, the $750K–under $1M band’s October closings rose from 4 to 9, but YTD closings fell from 61 to 56 and August–October closings edged down from 23 to 22. One stronger month does not establish accelerating demand.
Build a selling plan around the homes competing with yours.
The recent comparison supports the slowdown: August–October closings fell from 60 to 40 in the $1.5M–under $2M band and from 37 to 18 at $2M–under $3M. Both ranges face more inventory than a year earlier.
Meanwhile, the $2M–under $3M October median changed only from $2,305,000 to $2,284,000, a decline of 0.9%, based on seven current-month closings. A relatively steady median does not mean unchanged sales volume or negotiating conditions.
Seller read: Launch with a supported price and preparation budget. Evaluate offers by likely net proceeds and terms. Buyer read: Compare relevant recent sales and listing history before proposing terms; aggregate weakness is not proof that a particular seller must accept them.
Review your price range, likely net proceeds and timing together.
The $3M–$5M range improved. Above $5M, the sample is tiny.
At $3M–under $5M, YTD closings increased from 22 to 29 (+31.8%). August–October closings rose from 7 to 11, October inventory fell from 24 to 14, and source supply declined from 8.5 to 4.1 months. Those measures point in a different direction from the $2M–$3M band.
At $5M and above, there were only two YTD closings, versus four, and no October closing in either year. Inventory increased from two to five. That is too little activity to support a confident monthly price trend or a broad claim that ultra-luxury demand collapsed.
Seller read: A $3.5M property and a $5.5M property need different competitive reviews. Location, land, condition and distinctive features matter especially when comparable sales are sparse. Buyer read: Investigate the specific property and alternatives rather than extrapolating from two transactions.
“Luxury” ($3M–under $5M) and “ultra-luxury” ($5M+) are working labels here, not official MLS definitions. Only two $3M–$5M properties closed in October; the longer-period comparisons provide essential context.
Get a property-specific comparison for your luxury home.
A falling condo median also reflects a changing sales mix.
Redmond’s October condo median was $575,500, down 39.1%. Closings fell from 31 to 16. In the same month, sales below $500K doubled from 3 to 6, while $750K–under $1M closings fell from 10 to 3 and $1M–under $1.5M closings fell from 12 to 2. A larger share of lower-priced transactions helps explain why the aggregate median needs careful interpretation; this is not a same-home depreciation measure.
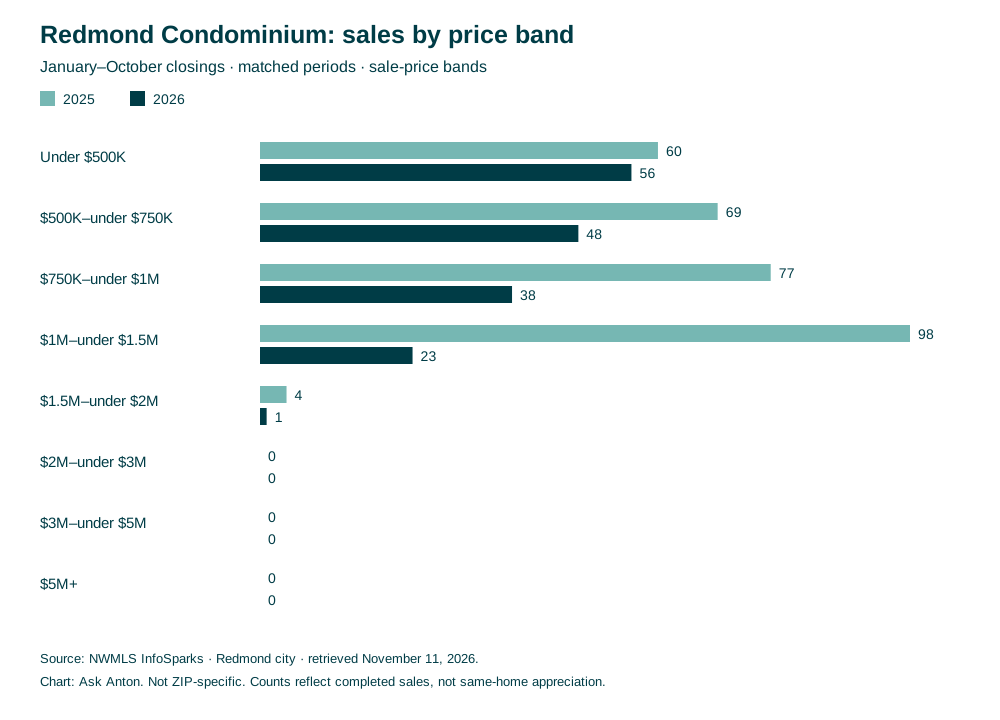
Condominium · Redmond city. Closings: January–October. Inventory and source months of supply: October month-end. Every arrow compares 2025 → 2026.
Sale-price band*
YTD closings
Change
Inventory*
Months of supply*
Under $500K
60 → 56
-6.7%
25 → 30
4.6 → 5.6
$500K–under $750K
69 → 48
-30.4%
30 → 32
4.4 → 7.2
$750K–under $1M
77 → 38
-50.6%
20 → 17
2.7 → 3.9
$1M–under $1.5M
98 → 23
-76.5%
10 → 11
1 → 3.8
$1.5M–under $2M
4 → 1Small sample
-75.0%
1 → 0
0.4 → Not reported
$2M–under $3M
0 → 0Small sample
Not meaningful
0 → 0
Not reported → Not reported
$3M–under $5M
0 → 0Small sample
Not meaningful
0 → 0
Not reported → Not reported
$5M+
0 → 0Small sample
Not meaningful
0 → 0
Not reported → Not reported
Condominium: where sales are happeningJanuary–October closings · 2025 versus 2026
20252026
Under $500K
60
56
$500K–under $750K
69
48
$750K–under $1M
77
38
$1M–under $1.5M
98
23
$1.5M–under $2M
4
1
$2M–under $3M
0
0
$3M–under $5M
0
0
$5M+
0
0
Bars begin at zero. Each property-type chart has its own scale. Exact counts and changes are in the table above.
$500K–under $750K YTD closings fell from 69 to 48; $750K–under $1M fell from 77 to 38. Current source supply was 7.2 and 3.9 months, respectively.
The $1M-plus mix changed sharply.
$1M–under $1.5M YTD closings fell from 98 to 23 (−76.5%). October inventory was 11 versus 10. Fewer completed transactions, rather than an enormous inventory count, distinguish this band.
A median can rise inside a weaker band.
The $500K–under $750K October median rose from $557,500 to $610,000, despite fewer YTD sales. Only five October closings support the current median. Even within a price band, the properties selling can change.
Seller read: Compare your unit with its building and competing developments, including dues, assessments, condition and financing eligibility. Buyer read: Review association reserves, insurance and total monthly costs. The aggregates do not establish which factor caused a slowdown.
City context: 90 condos for sale versus 86; source supply 5.3 versus 2.9 months. Source CSVs: prices · closings.
Compare your condo with the alternatives buyers can choose.
New residential sales rose. New condo closings fell sharply.
Redmond city · January–October closings · matched periods
Property category
Construction type
2025
2026
Change
Residential
New Construction
25
35
+40.0%
Residential
Previously Owned
564
453
-19.7%
Condominium
New Construction
105
26
-75.2%
Condominium
Previously Owned
203
140
-31.0%
New-construction residential closings increased from 25 to 35, while resales fell from 564 to 453. October resale inventory rose from 100 to 211; new-construction inventory fell from 21 to 10. The increased competition is concentrated in existing residential listings.
New-construction condo closings fell from 105 to 26 (−75.2%); condo resales fell from 203 to 140. New construction’s share of condo closings fell from 34.1% to 15.7%. That is another measured change in sales mix. Project completion schedules, absorption and pricing deserve investigation, but these exports do not identify the cause.
Seller read: Explain the value of your home relative to current new and resale alternatives. Buyer read: Compare delivery timing, included features, financing and total costs. Construction and price bands are separate dimensions, not a cross-tab identifying the same transactions.
Compare your home with both resale and new-construction choices.
Townhouse closings fell in both MLS property categories.
Redmond city · Style Code: Townhouse · 2025 → 2026
MLS property category
YTD closings
Aug–Oct closings
October inventory
October median
Residential
76 → 38
30 → 12
16 → 21
$918,0005 October closings
Condominium
128 → 59
45 → 15
28 → 32
$632,5003 October closings
Residential townhouse-style YTD closings fell 50.0%; condominium townhouse-style closings fell 53.9%. Inventory increased in both categories. The matched August–October results also show fewer closings.
Seller read: Compare with the correct ownership form and style, then narrow by location, age, layout and price. Buyer read: Confirm ownership, dues, maintenance responsibilities, insurance and financing from the actual documents. “Townhouse” is a style field; it does not establish legal ownership or association obligations.
The exported Style Code chart includes selected styles, not every possible style. Its buckets do not sum to the city total, and no missing style is inferred. Townhouse counts are preserved separately for Residential and Condominium; no combined median is calculated. October samples of five and three closings are too small for confident appreciation claims.
Build a townhome comparison around the specific property.
*InfoSparks uses sale price for sold-based metrics and original list price for non-closed metrics. Properties can move between bands. Inventory and closings are not a tracked cohort. Source months of supply uses a trailing 12-month sales pace; it is not inventory divided by October closings. Monthly medians and list-price ratios are not averaged into YTD medians. Ratios exclude concessions, and an original-price measure can reset under a new MLS listing ID.
Actual Redmond city exports, with residential and condominium results shown separately. Change the time window and graph style to see seasonality, direction and the difference between the two markets.
Closed Sales
ResidentialCondo
Compare like months and consider sample size. Seasonal patterns and property mix can affect the result.Exact chart values
Closed Sales · NWMLS InfoSparks · Redmond city · through Oct 2026
Price measures reflect the properties that sold. A changing mix can move this line without the same home changing value by the same amount.Exact chart values
Median Sales Price · NWMLS InfoSparks · Redmond city · through Oct 2026
Compare inventory with accepted offers and closings. More choices and fewer transactions call for a clear reason to choose your home: pricing, condition, terms or a combination.
For buyers: test the opportunity.
More inventory can expand your choices, but it does not make every listing negotiable. Use comparable sales, property condition, competing offers and your payment budget to build an offer.
City results are not sums of the ZIP reports. InfoSparks median days and median list-price ratios also differ from FastStats measures; compare each series only with its own definition. Rolling 12-month medians are exported from the source, not averages of monthly medians. Retrieved November 11, 2026.
Turn the trend into a plan for your property.
Get help comparing the homes that matter to your sale or purchase.
Compare the same periods in both years. Switch property type before drawing a conclusion about your home.
Showing residential · October 2026 vs 2025. Inventory and supply always show the October snapshot. 43 closed sales across the selected ZIPs in October 2026.
Median sale price
October
20252026
Use the median to understand the sales mix. Price your home from comparable properties, condition and competing inventory.Exact values and source changes
Residential · October · Median sale price
ZIP
2025
2026
Source change
98052
$1,700,000
$1,355,000
-20.3%
98053
$1,460,000
$1,412,500
-3.3%
Closed sales
October
20252026
Completed sales show the size of the sample. A handful of luxury or entry-price closings can move the median sharply.Exact values and source changes
Residential · October · Closed sales
ZIP
2025
2026
Source change
98052
42
21
-50.0%
98053
20
22
+10.0%
Pending sales
October
20252026
Accepted offers help track buyer activity. A pending sale can still fail to close; this count is not a closing forecast.Exact values and source changes
Residential · October · Pending sales
ZIP
2025
2026
Source change
98052
37
23
-37.8%
98053
14
19
+35.7%
New listings
October
20252026
New listings add competing choices. Review the properties entering your price bracket before you choose a launch price.Exact values and source changes
Residential · October · New listings
ZIP
2025
2026
Source change
98052
49
48
-2.0%
98053
22
34
+54.5%
Homes for sale
October
20252026
Available inventory is a snapshot, not a flow to add across months. More alternatives make condition and positioning more consequential.Exact values and source changes
Residential · October · Homes for sale
ZIP
2025
2026
Source change
98052
74
122
+64.9%
98053
46
92
+100.0%
Months of inventory
October
20252026
Use the source supply measure as context for negotiating conditions. It is not a prediction of how long your home will take to sell.Exact values and source changes
Residential · October · Months of inventory
ZIP
2025
2026
Source change
98052
2.1 mo
4.1 mo
+95.2%
98053
2.1 mo
5.1 mo
+142.9%
Days on market until sale
October
20252026
This source measure describes homes that sold. It excludes the full eventual marketing time of homes still waiting for a buyer.Exact values and source changes
Residential · October · Days on market until sale
ZIP
2025
2026
Source change
98052
38 days
34 days
-10.5%
98053
33 days
36 days
+9.1%
List price received
October
20252026
This ratio does not account for concessions. It is not a seller net-proceeds estimate and should not be treated as a sale-to-original-price measure.Exact values and source changes
Residential · October · List price received
ZIP
2025
2026
Source change
98052
98.4%
95.5%
-2.9%
98053
99.0%
99.6%
+0.6%
Average sale price
October
20252026
Compare the average with the median. A few expensive transactions can pull the average away from the typical transaction in the sample.Exact values and source changes
Residential · October · Average sale price
ZIP
2025
2026
Source change
98052
$1,802,271
$1,383,929
-23.2%
98053
$1,457,725
$1,673,386
+14.8%
What does this mean for your asking price?
Compare your property with the homes buyers can choose today.
The 30-year benchmark eased from 7.18% the prior week to 7.11%, but remained above the year-earlier 6.24%. A recent decline can help payment math without returning affordability to last year’s level.
2026 mortgage rates: 30-year and 15-year fixed
30-year fixed15-year fixed
National conventional conforming purchase-loan averages. These are interest rates, not APRs or personalized quotes. Jumbo, condo and individual borrower pricing can differ. The vertical scale begins at 4% to make weekly movement readable.Exact chart values
2026 mortgage rates: 30-year and 15-year fixed · Freddie Mac PMMS · weekly · through Nov 12, 2026
These are adjustable illustrations, not loan offers or qualification results. Start with your lender’s quote if you have one.
Other monthly housing costs start at an illustrative $1,200. Replace this with your property taxes, insurance, HOA dues, mortgage insurance and other recurring costs. This is not a Redmond tax or insurance estimate. Maintenance, closing costs and cash reserves need separate budgets. All scenarios use a 30-year term and the same down-payment percentage.
Illustrative loan amount$960,000$240,000 down
Principal & interest / month$6,45830 years at 7.11%
With your other monthly costs$7,658Estimate, before unbudgeted expenses
Same home, different rate: monthly payment
Monthly principal & interest
At the same loan amount, a rate one percentage point higher changes monthly principal and interest by $660. This is a sensitivity calculation, not a rate forecast.Exact chart values
Same home, different rate: monthly payment · Illustration · $960,000 loan · 30 years
Period
Monthly principal & interest
6.11%
$5,824
6.61%
$6,137
7.11%
$6,458
7.61%
$6,785
8.11%
$7,118
Same payment budget, different purchase price
Illustrative purchase price
This holds principal and interest constant. The cash down payment changes with the price. Taxes, insurance, HOA, qualification and loan limits are excluded; this is not an approved buying budget.Exact chart values
Same payment budget, different purchase price · Illustration · $6,000/mo P&I · 20% down
Period
Illustrative purchase price
6.11%
$1,236,316
6.61%
$1,173,122
7.11%
$1,114,899
7.61%
$1,061,177
8.11%
$1,011,535
SELLING
Understand the buyer’s constraint.
Compare a price adjustment with a possible seller credit using lender-confirmed costs and limits. Evaluate your net proceeds and the buyer’s actual benefit; a credit and a price cut are not interchangeable.
BUYING
Make today’s payment work.
Compare price, cash needed and total monthly costs. A future refinance is uncertain. Choose a payment you can carry under the loan terms you actually accept.
SELLING + BUYING
Model both sides of the move.
A low existing mortgage rate is only one input. Compare equity released, replacement-home costs, moving costs, temporary overlap and your timeline.
What does the payment mean for your plan?
Bring your price range and timing. We’ll help frame the property questions and the financing questions to take to a lender.
Historical October 2026 results. Each interpretation is a starting point for a current property review.
Two ZIPs. Different October signals.
In 98052, residential closings fell 50% to 21 and inventory rose 64.9% to 122. In 98053, closings rose 10% to 22 even as inventory doubled to 92. More supply did not produce the same monthly sales result in both postal markets.
The longer view is softer in both: January–October residential closings fell 18.7% in 98052 and 16.2% in 98053. For condos, 98052 had 13 October closings and 5.4 months of supply; 98053 had just three closings and 4.5 months. Treat the smaller condo sample cautiously when comparing prices.
Residential inventory was 122 homes (+64.9% year over year), with 4.1 mo of reported supply. The source's days-on-market measure was 34 days.
Seller read: More homes were competing for attention than a year earlier. Make your price and presentation credible against the alternatives in your segment. Use accepted offers and current competitors to test whether the closing data still reflects today’s choices.
Buyer read: Compare your choices in this ZIP with the specific home’s condition, asking price and competing offers. More inventory can create options, but a ZIP average cannot establish the discount or concessions available on an individual listing.
Condo comparison: $541,000 median, 13 sales, 5.4 mo of supply. Different property types need separate pricing reviews.
Residential inventory was 92 homes (+100.0% year over year), with 5.1 mo of reported supply. The source's days-on-market measure was 36 days.
Seller read: More homes were competing for attention than a year earlier. Make your price and presentation credible against the alternatives in your segment. Use accepted offers and current competitors to test whether the closing data still reflects today’s choices.
Buyer read: Compare your choices in this ZIP with the specific home’s condition, asking price and competing offers. More inventory can create options, but a ZIP average cannot establish the discount or concessions available on an individual listing.
Condo comparison: $610,000 median, 3 sales, 4.5 mo of supply. Different property types need separate pricing reviews.
98052 and 98053 are separate postal markets. A Redmond mailing address does not establish a location inside Redmond city. 98073 is not listed as a separate report in the FastStats area selector checked November 13, 2026; use the physical street-address ZIP. City of Redmond geography guidance.
Your competitive set / Price and property features
Find the market your home actually competes in.
Compare all eight price ranges, or switch to construction type, bedrooms, square footage, lot size, waterfront or style code. These are Redmond city segments, not ZIP-specific cross-tabs. Each feature is analyzed separately.
Read the price basis: InfoSparks uses sale price for metrics based on sold data and original list price for non-closed metrics. A home can move between brackets. Do not divide this month’s bracket inventory by closings and call it the source’s months of supply. Source supply uses a trailing 12-month average sales pace.
Some historical bucket totals differ from the source all-price total. Original values are retained. October 2025 and 2026 price-band counts reconcile; historical differences are listed in the reconciliation CSV.
Closed Sales by price range
October 2025October 2026
Each bar begins at zero. On a small screen, scroll horizontally to read the full chart. Missing values are labeled, not replaced with zero. Full range boundaries and exact values appear below.
Residential · Redmond city · Closed Sales. Changes calculated from exported values.
Price Range
Oct 2025
Oct 2026
Change
Oct 2026 closings
$499,999 or Less
1
0
-100.0%
0 · small sample
$500,000 to $749,999
1
1
0.0%
1 · small sample
$750,000 to $999,999
4
9
+125.0%
9
$1,000,000 to $1,499,999
20
15
-25.0%
15
$1,500,000 to $1,999,999
21
10
-52.4%
10
$2,000,000 to $2,999,999
12
7
-41.7%
7
$3,000,000 to $4,999,999
4
2
-50.0%
2 · small sample
$5,000,000 or More
0
0
Not meaningful
0 · small sample
A zero sales count is a reported result; an unavailable price is not a $0 sale. Fewer than five closings is flagged as a small sample here. No median is reconstructed from other medians, and no percentage change is computed from a zero baseline.
October inventory70
October closings15
October median sale price$1,225,000
$1,000,000 to $1,499,999: Closed Sales
Residential
Two years of monthly observations. Blank periods break the line. Use the sales count alongside price and ratio changes; price-bracket medians are constrained by the selected range.Exact chart values
$1,000,000 to $1,499,999: Closed Sales · NWMLS InfoSparks · Redmond city · Residential · Oct 2026
Period
Residential
2024-11
18
2024-12
12
2025-01
6
2025-02
15
2025-03
12
2025-04
20
2025-05
17
2025-06
22
2025-07
22
2025-08
21
2025-09
21
2025-10
20
2025-11
14
2025-12
15
2026-01
7
2026-02
11
2026-03
20
2026-04
16
2026-05
21
2026-06
19
2026-07
21
2026-08
22
2026-09
25
2026-10
15
Seller read: make the comparison specific.
Start with the properties buyers can choose in this segment. Compare their asking prices, condition and terms with recent comparable closings, then decide where your home should compete. New construction and resale can attract different buyers and offer different incentives.
Buyer read: narrow the search, then verify.
Use the segment to find relevant alternatives. A more expensive home, larger lot or newer build is not automatically better value. Review condition, usable space, ownership rights and the full cost before deciding what to offer.
InfoSparks metric definitions · Retrieved November 11, 2026. Price measures exclude concessions. Source data can be revised. Property classifications and price ranges alone do not establish comparability.
05 / Protect your net
The best price is only part of the decision.
Compare the complete offer.
Look at credits, preparation costs, financing, contingencies and timing alongside price. An aggregate list-price ratio cannot tell you the proceeds from your own sale.
Get specific estimates and a realistic schedule. If the project delays your move, include carrying costs and the risk that buyers will value the work differently.
Buyers / Use the same evidence from the other side
Yes, buyers can use this report too.
The seller focus helps explain how homes compete. For a buyer, those same measures help narrow the search, assess negotiating room and avoid making an offer from a citywide headline.
01 / CHOICES
Find the market you can buy in.
Filter residential and condos separately. Compare your ZIP and price range, then look at the actual available homes. More listings do not necessarily mean more properties that fit your needs.
02 / TERMS
Make a supported offer.
Use recent comparable sales, the property’s listing history, condition and competing offers. Explore price, repair or closing-cost terms where appropriate. Keep inspection, financing and other protections tied to the specific transaction.
03 / COST
Look beyond the sale price.
Use the rate scenarios, then obtain lender quotes and property-specific expenses. For condos, review dues, reserves, assessments, insurance and financing eligibility. For houses, budget for condition and maintenance.
What the data can tell you
How much choice exists, how transactions are changing, how long sold homes were marketed and how outcomes differ by property type.
What still needs a property review
What this home is worth, whether the seller will negotiate, what repairs are needed and whether the financing and monthly costs work for you.
Build a buying plan from the data.
Choose Buying or Selling and buying in the form above.
CSV period: October 2026. Original FastStats PDFs are available below. City and segment graphs include their source CSVs; charts download individually as SVG files.
Yes. Compare property types and ZIPs, inspect the city trends, and use the payment scenarios to frame a search and offer strategy. Then review the actual property, comparable sales, condition, financing and competing offers. More inventory does not guarantee a discount on every home.
Are the mortgage rates a quote for my Redmond purchase?
No. The chart shows dated Freddie Mac national averages for conventional conforming purchase loans. Your rate and APR depend on the loan, credit, down payment, fees, lock period and property. Jumbo and condo financing can differ. Ask a lender for a property-specific quote and compare the full monthly cost.
Should I wait for rates to fall before buying or selling?
The report does not forecast rates. Compare a move you can afford under today’s quoted terms with the costs and uncertainty of waiting. If you are selling and buying, model net proceeds and replacement-home costs together. Do not rely on a future refinance to make the initial payment affordable.
What is my Redmond home worth?
A ZIP median is a starting point for market research, not a property valuation. A useful pricing review compares your location, property type, size, condition and features with recent closings, pending properties and current competitors. Ask for a supported range and a selling plan.
Should I sell now or wait?
Start with your move, carrying costs and financial flexibility. Compare the likely net proceeds and timing risks of selling now with the cost of waiting. A seasonal pattern or changing median cannot guarantee a better future price.
Why separate houses and condos?
Residential and condominium properties can have different inventory, pricing and buyer pools. These reports preserve the MLS categories. Residential should not be assumed to mean detached houses only; confirm the property classification when selecting comparable listings.
Does a lower median mean my home lost that much value?
No. The median depends on which homes sold. Changes in size, condition, location and the share of luxury sales can change it. These aggregate reports do not follow the same properties over time.
Are Redmond city and Redmond ZIP codes the same market?
No. Postal areas are not municipal boundaries. The two ZIP reports are separate postal markets; their medians are not combined into a Redmond city median. Use the physical property location for a city-specific comparison.
What about 98073?
This report covers the street-address postal markets 98052 and 98053. It has no separate FastStats housing dataset for 98073. Use the physical property address to select the relevant housing market. A Redmond mailing address is not proof that a property is inside the city boundary.
Should I remodel before listing?
Scope repairs and presentation work against actual competing properties. Compare the cost, delay and uncertainty of the project with selling in current condition. Spending more does not guarantee a higher sale price or a higher net.
Do I need to sign up to read the data?
No. Charts and aggregate CSV downloads are available without a signup. If you choose to use the digital assistant, review its disclosures and edit your message before sending.
Ready to make this specific to you?
Bring your property, budget and timing into the conversation.
Matched periods. Monthly and year-to-date comparisons use the periods printed in each report. The nine source measures are extracted separately for residential and condo properties. Source percentage changes are retained, including rounding.
Inventory. Inventory and months of supply are monthly snapshots; the source has no year-to-date value for them. Selecting year to date leaves those two charts explicitly on the monthly period. Months of supply is reproduced from FastStats, not recalculated as inventory divided by this month’s closings.
Geography. ZIPs are postal-market geographies and may include areas outside Redmond city. The MLS city selection is not a legal boundary survey. Counts can be summed across the two source ZIPs as a postal-market total. Medians, ratios, days on market and supply are not summed or averaged into a citywide statistic.
Price and market time. Medians describe the mix of completed sales, not appreciation of the same home. The report’s days-on-market measure is preserved under its own label; it is not relabeled as a median or cumulative days active. Price and list-price measures exclude concessions and down-payment assistance.
Small samples. Sales counts appear alongside prices. A large percentage change based on a few closings is not proof of a lasting trend. Individual comparable properties and longer matched periods are necessary before making a pricing recommendation.
City history. Redmond city was selected in NWMLS InfoSparks. Sixteen original CSV exports cover January 2023–October 2026 and separate Residential and Condominium. Original exports are archived with hashes and available beneath their charts. InfoSparks days on market runs from listing to an accepted offer. Closed-based months of supply divides month-end inventory by average monthly closings over the prior 12 months; pending-based supply uses the corresponding pending pace. Price filters use sale price for sold-based metrics and original list price for non-closed metrics. Median list-price ratios retain their export labels and exclude concessions. These measures are not substituted for FastStats averages. See the source definitions.
Rates and scenarios.Freddie Mac PMMS weekly national averages are shown through November 12, 2026, checked November 13. Payment scenarios use fixed-rate monthly amortization over 360 payments. They are calculated illustrations, not observed Redmond loan pricing or forecasts. No causal effect of rates on Redmond prices is estimated.
Coverage and limitations. October ZIP FastStats and 46 months of Redmond city InfoSparks history are included. Eight price ranges, construction type, bedrooms, square footage, lot size, waterfront and selected style codes are included for Redmond city. These are separate dimensions, not all possible cross-filter combinations or ZIP-specific price brackets. Source segment totals are not forced to equal all-category totals; differences are disclosed beside the relevant views. No property valuation is inferred from a city or ZIP median.
Educational market information. This is a dated snapshot and may be revised by the source. It is not an appraisal, a guaranteed price, a promise of timing or a substitute for property-specific advice. See brokerage disclosures, Privacy and Terms.