From the AskAnton archive. This report retains its original figures and source dates. It is not a live market feed. Confirm current prices, rates, rules and property details before acting.
Snohomish County by the Numbers (June 2026)
The Snohomish County Market, in Data
Inventory has tripled off the 2021 bottom and prices have cooled at the edges, yet supply is still under the balanced line. Here is the whole market in five pictures, then the version that matters for you below.
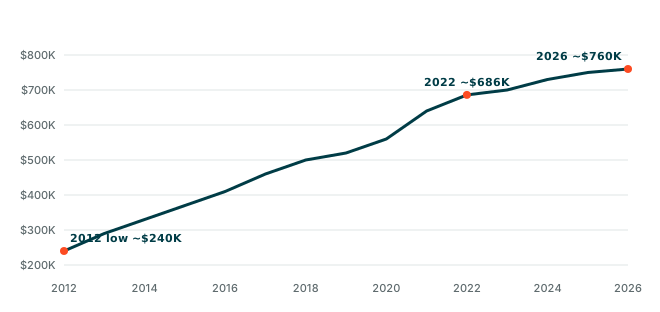
Median sale price, Snohomish County (2012 to 2026)
From the 2012 trough near $240K to about $760K today, roughly a 217% climb, with the steepest run from 2020 to 2022.
Months of supply by segment (June 2026)
Under 4 months still favors sellers. Only condos have reached the balanced band; new construction is close behind.
Price change by property type, year over year
Resale has held up. The discounts are concentrated in condos and builder inventory, which is exactly where buyer leverage lives.
Market temperature today
Seller's <4Balanced 4-6Buyer's >6
Source: NWMLS monthly snapshot (May 2026), FHFA All-Transactions HPI for the long-run shape, and The Madrona Group county report. Annual price points before 2022 are indexed to the FHFA series and anchored to NWMLS medians.
If you are buying: the closest thing to a buyer's market since 2012, but not a buyer's market
Snohomish County is shifting from extreme seller dominance toward balance, but the shift is uneven. Active listings are up about 37% year over year to 2,789 homes, yet the county still sits at just 2.2 months of resale supply, well under the 4-to-6-month balanced threshold.1 The real change is behavioral: you finally have enough options to be selective and payment-focused. The winners right now know which segments carry leverage and which still require speed.
The affordability reality nobody is sugarcoating
At a 6.60% rate and a roughly $760,000 median price, the all-in monthly cost on a 10%-down purchase runs about $5,200 to $5,280 per month (principal, interest, taxes, insurance, and PMI).2 To carry the median home comfortably under a 28% front-end ratio, you need to earn roughly $225,000 a year. The county's median household income is about $108,000.3 That gap is the single most important fact in this market: the realistic buyer pool is dual-income households earning $160K to $200K-plus, Boeing and tech professionals, and move-up buyers bringing equity from a prior sale.
Where you actually have leverage today
- Condos. 4.0 months of supply and down about 9.8% in average price year over year. This is the one segment where a genuine buyer's-market dynamic has emerged.4
- New construction. Average price down about 12.4% year over year. Builders are competing with 2-1 rate buydowns, preferred-lender credits, and closing-cost help at a scale not seen since 2018.
- Overpriced, stale resale. Any listing sitting past 14 to 21 days is signaling motivation. The first two weeks define a home's market response; after that, sellers usually have to come to you.
- Rate buydowns. A seller- or builder-funded 2-1 buydown can drop your first-year rate to roughly 4.6% (a payment cut near $860/month on a $675K loan). In a market where sellers are motivated, this is the most underused tool there is.
Where you still have to move fast: a correctly priced, move-in-ready resale home in a strong school district between $500K and $900K. That is the most competitive product in the county, and good ones still go in days.
The true cost of owning here
Property taxes run about 0.79% to 0.83% (roughly $6,000 a year, or $500/month, on a $760K home).5 Budget $1,200 to $2,000 a year for insurance (more in flood or older-home situations), and about $281/month in PMI if you put 10% down. One bright spot: Snohomish is a high-cost county, so the 2026 conforming loan limit is $1,063,750, which keeps most buyers out of jumbo territory.6
The buyer's math, in data
The affordability gap that defines this market
Median single-family price by city (2026)
The south county and waterfront cities trade at a clear premium. Everett and the north end (in poppy) are where the value is.
Price appreciation by city, year over year
Transit is the divider. Lynnwood, with its new light rail station, is the only city posting strong gains while the county overall slipped.
Where your $5,257 monthly payment goes (median home, 10% down)
About 82% is principal and interest, which is exactly what a rate buydown attacks. Drop the first-year rate to ~4.6% and the payment falls roughly $860/month.
Source: The Madrona Group payment model, Snohomish County Assessor (effective tax ~0.80%), NWMLS city-level medians (May 2026). City prices are representative single-family averages and vary by submarket and month.
Best cities for buyers right now
- Everett – the most affordable major city (about $646K average single-family), Boeing and Providence on your doorstep.
- Lynnwood – the only city posting real appreciation (+5.8% YoY) thanks to the Lynnwood City Center light rail station (28 minutes to downtown Seattle).7
- Lake Stevens – the county's #1-ranked school district and a family-first feel.8
- Marysville, Arlington, Stanwood – the value end ($500K to $650K), 15 to 20 minutes to Boeing Everett.
Quick context worth knowing: violent crime is low (a B safety grade countywide) but vehicle-related property theft is the real concern in Everett and Lynnwood cores; flood risk concentrates in the river valleys (Snohomish, Stillaguamish, Skykomish), and wildfire risk is in the eastern foothills, not the suburban south.4
How Snohomish stacks up for buyers
| Metric | Snohomish | King | Pierce |
|---|---|---|---|
| Median price (May 2026) | $759,875 | $875,000 | ~$555,000 |
| YoY price change | Down ~2.2% | Flat to slight decline | Up 3.3% |
| Months of supply | 2.6 | 3.4 | ~4 |
| Median household income | ~$108K | ~$125K | ~$85K |
| Light rail access | Lynnwood (now) | Seattle/Eastside | Tacoma T-Line |
| Best 2026 buyer opening | Condos, new build, transit-adjacent | Eastside correction zones | Bonney Lake, Kent, Federal Way |
Snohomish offers the best balance of price, schools, and Boeing-driven job stability, at a 13% to 15% discount to King County.
If you are selling: this market rewards preparation and precision, not hope and waiting
Inventory is up 37% and buyers have more choices than at any point since 2012, yet the county is still in seller's territory at 2.2 months of resale supply.1 The sellers capturing full value understand the market changed. It is no longer enough to put a sign in the yard and wait. The seller who wins in 2026 prices accurately on day one, presents the home as a polished product, and uses a smart concession strategy to bridge the buyer's affordability gap without giving away net proceeds. The sellers losing are the ones still anchored to 2022 peak prices.
Price it right on day one, because the first two weeks decide everything
The countywide list-to-sale ratio is 99.4% (99.8% for residential resale), which means correctly positioned homes are still closing within a whisker of asking.2 But that number describes the final list price, not the original one. Overpriced homes sit, collect days on market and stigma, and end up taking a 2% to 5% reduction that nets less than accurate pricing would have from the start. Past 21 days on market, buyers start asking what is wrong with the house. The first-mover in a price band captures the buyers who are ready to act.
The improvements that actually pay you back
- Fresh neutral interior paint – 200% to 500% ROI, low cost.
- Deep clean, declutter, de-odorize – near-zero cost, maximum first impression.
- Minor kitchen and bath refresh (hardware, paint, lighting) – strong ROI without a full remodel.
- Curb appeal (mulch, trim, flowers) – high ROI for $500 to $2,500.
- Professional staging and photography – staged homes sell 6 to 10 days faster and for 1% to 5% more; in a 28-day-average market, that first-week traffic is the whole ballgame.
What to skip: full kitchen remodels ($40K to $80K rarely recoup at today's values), a new roof unless it is a disclosed defect, and finishes above the neighborhood's ceiling.
Concessions are a scalpel, not a discount
At 6.60% rates, a seller-funded 2-1 buydown costs roughly $10,000 to $20,000 on a $700K to $800K sale and can be the difference between a fast sale and a home that sits. Structured right, a buydown nets you more than a price cut of the same dollar amount, because it directly attacks the buyer's monthly payment, which is what is actually stopping them.
Condo sellers: you are in a different market
At 4.0 months of supply and down about 9.8% year over year, condos are the one product type where a buyer's market has genuinely arrived.4 Condo sellers need to price sharper, present better, and expect to offer more in concessions than countywide averages suggest.
What it costs to sell, and the best time to do it
Plan on total seller closing costs of roughly 6% to 8% of the sale price: commission (4.5% to 6%, now negotiated separately post-2024 settlement), Washington's tiered Real Estate Excise Tax (1.10% up to $525K, 1.28% to $1.525M, and up), plus escrow and title.9 On an $800,000 sale, that is about $52,000 to $64,000 before any concessions. On timing: June and early July are still inside the strong spring-to-summer window. The fall (September through November) historically slows as inventory keeps climbing, and January to February is the weakest. If you are ready and prepared, listing now beats waiting.
What sells, and what it nets
Where your money goes when you sell an $800K home
Total closing costs run about 6.6% before any concessions. Commission is the big lever, and it is now negotiated separately post-settlement.
Return on cost: the prep work that actually pays back
Cheap, cosmetic, buyer-facing work wins. The full kitchen remodel (in poppy) usually returns less than you spend at today's values.
Average days on market by property type
Move-in-ready resale is still the fastest product in the county. Condos and builder inventory take longer, so price and present accordingly.
Source: WA Dept. of Revenue (graduated REET), NWMLS days-on-market (May 2026), and industry return-on-cost ranges. Returns are estimates and vary by home, price band, and finish level.
How Snohomish stacks up for sellers
| Metric | Snohomish | King | Pierce |
|---|---|---|---|
| Median price (May 2026) | $759,875 | $875,000 | ~$555,000 |
| YoY price change | Down ~2.2% | Flat to slight decline | Up 3.3% |
| Resale months of supply | 2.2 | 3.4 | ~4 |
| Days on market | 28 | 40+ | Varies |
| List-to-sale ratio | 99.4% | Softer on Eastside | Below 99% in spots |
| Strongest seller position | $500K to $900K resale, top schools | Tech corridor, top schools | Appreciating South Sound cities |
Snohomish sellers are structurally stronger than King County sellers in 2026: a lower price point means a deeper buyer pool, and the Boeing economy adds stability King County's tech-heavy pool lacks.
What is your Snohomish County home actually worth?
Automated estimates (Zillow, Redfin) lag the real market by 30 to 90 days and miss your home's condition, finishes, and exact location. The only number that matters is a current, comparable-based valuation from someone selling in your specific submarket every month. I will build you a real one, free, with the pricing and prep plan to net the most in this market.
If you are investing: the standard playbook is dead at median, and the sophisticated plays are the best they have been since 2012
Here is the blunt truth about Snohomish County in 2026: the 1% rule fails by a factor of 2.5 at median pricing, DSCR lending barely works at median home values, and a standard buy-and-hold single-family rental cash-flows negative for most acquisitions.10 But the operator who understands the segmentation finds real opportunity. ADU development unlocks the strongest yield in the county. Mid-term rental unlocks a 50% to 80% premium over long-term rent. Value-add multifamily in Everett corrected 10% to 15% from peak and now trades at 5.5% to 6.5% going-in caps.
Which strategy actually pencils (1 to 10 viability)
| Strategy | Cash Flow | Appreciation | 2026 Viability |
|---|---|---|---|
| ADU development | 9 | 7 | 9 |
| Mid-term rental | 8 | 6 | 8 |
| Small multifamily (2-4 unit) | 5 | 7 | 7 |
| Short-term rental | 7 | 6 | 7 |
| Land / middle-housing dev | Variable | 9 | 7 |
| Buy-and-hold SFR | 3 | 8 | 6 |
| BRRRR | 5 | 7 | 6 |
| Fix and flip | 6 | N/A | 5 |
Strategy viability in 2026 (1 to 10)
The same scorecard above, ranked visually. Development and operating-intensive plays beat the old buy-and-hold default.
Play #1: ADU development is the highest-yield move in the county
Under HB 1337 and Snohomish County's Ordinance 25-014 (passed March 2025), you can build up to 2 ADUs per lot in all urban county zones, with no owner-occupancy requirement, and you can sell the ADU as a condominium.11 A single-family lot can now legally support three units. A detached ADU built for $300,000 to $400,000 rents for $2,500 to $3,200 a month, a roughly 12% to 13% gross yield on build cost, the strongest in the county. And because anything built after 2013 is exempt from the new rent cap for 12 years, you can reset to market rent at every new tenancy.
Play #2: mid-term rental in the Boeing and Providence corridors
MTR (furnished 30-to-90-day stays) is excellent and underused here. Providence's $500M healthcare campus rotates travel nurses on 13-week contracts; Boeing Everett brings in contractors on 6-week-to-6-month assignments; Naval Station Everett drives PCS housing needs.12 A furnished 3-bed near Providence or Boeing commands roughly $3,500 to $4,500 a month all-in, versus $2,200 to $2,600 unfurnished, a $500 to $1,500 net premium after furnishing and fees. MTR also sidesteps the rent-cap math, because each 30-to-90-day tenancy reprices at market.
Play #3: value-add multifamily in Everett
Suburban King/Snohomish value-add multifamily corrected 10% to 15% from 2022 peaks. A 386-unit Lynnwood community traded at about $321K/unit in early 2025; a 352-unit Everett property refinanced near $234K/unit in June 2026.13 Going-in caps of 5.5% to 6.5% are available in Everett, the best entry in the county. With only 2% of inventory under construction, the supply squeeze gets materially more favorable for owners in 2027 to 2029. Buy at a 5.5% to 6.5% going-in cap, push rents via turnover over 24 to 36 months, and exit at a 4.75% to 5.25% cap.
BRRRR, flips, and short-term rentals: viable but situational
BRRRR works in the $450K to $550K acquisition band but deal sourcing is the constraint (28-day average DOM means almost no distressed MLS inventory; you need an off-market pipeline). Flips are margin-compressed nationally, but a Marysville or Monroe buy at $420K plus $65K rehab to a $600K ARV can still net around $57K for an experienced operator. Short-term rentals run 64% occupancy and a $175 ADR countywide, higher in the city of Snohomish ($290 ADR), but watch for a future county STR ordinance.14
The Legislation Every WA Investor Must Know
HB 1217 (rent stabilization, effective May 2025): caps annual increases on existing tenancies at 7% plus CPI (9.683% in 2026), but buildings under 12 years old are exempt. That single exemption is reshaping how sophisticated investors underwrite new construction and ADUs.15
HB 1110 / HB 1337 (middle housing + ADUs): turned single-family lots into 3-to-4-unit development opportunities. Washington's capital gains tax explicitly excludes real estate, and there is no state income tax, which keeps drawing investors and demand into the state.
Why the standard playbook is dead at median
The 1% rule, tested against Snohomish reality
Going-in cap rates by county (value-add multifamily)
Snohomish prices wider than King, which is the whole opportunity: buy at 5.5-6.5%, push rents over 24-36 months, exit toward a King-style 4.75-5.25%.
The rent premium that makes a deal pencil
A furnished mid-term rental near the Boeing and Providence corridors commands a 50%+ premium over long-term rent, and reprices to market every 30 to 90 days.
Source: Kidder Mathews multifamily report (Q1 2026), AvenueWest MTR data, and county rent surveys. Cap rates, rents, and yields are ranges that vary by asset, condition, and submarket.
Snohomish is not one market: where each strategy fits
| Submarket | Best Strategy | Typical Entry |
|---|---|---|
| Everett | Value-add MF, BRRRR, Section 8 | $550K to $750K |
| Lynnwood | Buy-hold, transit TOD, ADU | $650K to $850K |
| Marysville | MTR near Boeing, BRRRR | $450K to $650K |
| Lake Stevens | Buy-hold, new construction | $550K to $700K |
| Snohomish city | STR, MTR, historic tourism | $650K to $900K |
| Monroe / Sultan | STR (US-2 recreation), BRRRR | $500K to $650K |
| Edmonds | Buy-hold, luxury rental | $900K to $1.2M |
| Bothell / Mill Creek | High-end SFR rental | $850K to $1.2M |
How Snohomish stacks up for investors
| Metric | Snohomish | King | Pierce |
|---|---|---|---|
| Median acquisition | $760K | $875K | $555K |
| Going-in cap (MF) | 5.5% to 6.5% | 4.75% to 5.25% | 6.0% to 7.5% |
| STR regulation | Low (county) | Tighter (Seattle) | Mixed |
| Pipeline supply risk | Low (2% UC) | Moderate | Low-moderate |
| Boeing concentration risk | High | Low | Low |
| Best strategy fit | MTR, ADU, value-add MF | Tech-corridor buy-hold | Flip, lower-priced buy-hold |
Snohomish is the strongest value-add multifamily play in the metro. Pierce is the strongest 2026 appreciation story. King is the deepest institutional market but needs the most capital.
Snohomish County Real Estate FAQ
What is the median home price in Snohomish County right now?
About $759,875 (NWMLS, May 2026), down roughly 2% year over year. Average prices run higher (around $817K) because luxury sales pull the average up; the median is the better gauge for most buyers and sellers.
Is Snohomish County a buyer's or seller's market in 2026?
Still a seller's market, but the most balanced one since 2012. Inventory jumped about 37% year over year, yet resale supply is only 2.2 months, well below the 4-to-6-month balanced range. It is segment-specific: condos and new construction favor buyers, while correctly priced resale in good school districts still moves fast.
How much do I need to earn to buy a house in Snohomish County?
Roughly $225,000 a year to comfortably carry the median-priced home with 10% down at 6.6%, under a 28% front-end ratio. The county's median household income is about $108,000, so most buyers are dual-income households or move-up buyers using prior-home equity.
Is now a good time to sell in Snohomish County?
If your home is ready, yes. June and July are still in the strong spring-to-summer window, the fall historically slows as inventory keeps rising, and correctly priced resale homes are still closing near 99.8% of list. The key is pricing accurately on day one and presenting the home well, not anchoring to 2022 peak prices.
Which Snohomish County cities are rising in value?
Lynnwood leads at about +5.8% year over year, driven by the Lynnwood City Center light rail station. Edmonds (+2.3%) and the Snohomish portion of Bothell (+1.5%) are also positive, while the county overall is roughly flat to down 2.2%.
Can you cash flow a rental in Snohomish County?
It is hard at median prices, where a standard single-family rental runs cash-flow negative at current rates. The cash-flow plays that work are ADU development (about a 12% to 13% yield on build cost), mid-term rentals near Boeing and Providence (a 50% to 80% premium over long-term rent), and acquisitions in the $400K to $550K band in Everett, Marysville, or Monroe.
Can I build an ADU in Snohomish County?
Yes. Under HB 1337 and county Ordinance 25-014, urban county lots can have up to two ADUs, with no owner-occupancy requirement, and the ADU can be sold as a condominium. A detached ADU typically costs $300,000 to $400,000 to build. Confirm your specific zone and lot with the county before you start.
What is the property tax rate in Snohomish County?
About 0.79% to 0.83% effective, or roughly $6,000 a year on a $760,000 home. Note that 2026 brought a countywide 2% levy increase and some city-specific jumps (Edmonds residents annexed into South County Fire saw about $780/year more).
How does Snohomish County compare to King County?
Snohomish runs about 13% to 15% cheaper than King County at the median, with strong school districts (Lake Stevens, Northshore, Mukilteo) and the stability of the Boeing and aerospace economy. The trade-off is a longer commute to Seattle and Boeing concentration risk. For many buyers it is the best balance of price, schools, and jobs in the metro.
What is the biggest risk in the Snohomish County market?
Boeing concentration. The Everett plant is the county's largest employer and economic anchor, and Boeing's production swings, strikes, and decisions move local housing demand more than any other single factor. Affordability (the income-to-price gap) and elevated rates are the other two structural pressures.
Sources & Data
Snohomish County figures are June 2026 data drawn from the sources below. Market conditions change; verify current numbers before acting. Dollar figures and projections are estimates, not guarantees.
- Northwest Multiple Listing Service (NWMLS), Monthly Market Snapshot, May 2026 – nwmls.com
- The Madrona Group / John L. Scott, Snohomish County Housing Market Report, June 2026 – themadronagroup.com
- Greater Seattle Partners, Snohomish County Economic Overview 2025 – greater-seattle.com
- Redfin, Snohomish County Housing Market (incl. First Street climate risk) – redfin.com
- Snohomish County Assessor, 2026 Property Tax Information – snohomishcountywa.gov
- Sammamish Mortgage, Washington Conforming Loan Limits 2026 – sammamishmortgage.com
- Sound Transit, Lynnwood Link Extension – soundtransit.org
- Niche, 2026 Best School Districts in Snohomish County – niche.com
- Washington Dept. of Revenue, Real Estate Excise Tax – dor.wa.gov
- Kidder Mathews, Seattle Multifamily Market Report Q1 2026 – kidder.com
- Washington State Legislature, HB 1337 (ADUs) – app.leg.wa.gov
- AvenueWest Global, Mid-Term Rental ROI 2026 – avenuewest.com
- The Registry Pacific Northwest, Snohomish multifamily transactions 2025-2026 – news.theregistryps.com
- Airbtics & AirROI, Snohomish County / Snohomish city STR data – airbtics.com
- Washington State Legislature, HB 1217 (Rent Stabilization) – app.leg.wa.gov
- HASCO / Snohomish County, Housing Affordability data, March 2026 – snohomishcountywa.gov
- The Urbanist, Snohomish County ADU and middle-housing reforms, 2025-2026 – theurbanist.org
- US Census Bureau QuickFacts, Snohomish County – census.gov
- FHFA / FRED, All-Transactions House Price Index, Snohomish County – fred.stlouisfed.org
- CrimeGrade.org, Snohomish County crime data – crimegrade.org